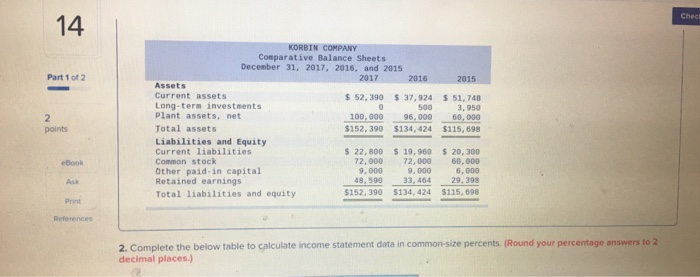
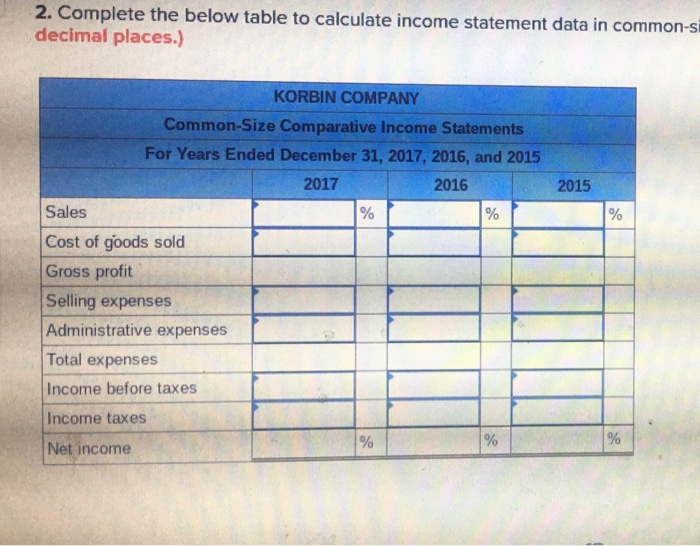
Chec 14 KORBIN COMPANY Comparative Balance Sheets December 31, 2017, 2016, n5 Part 1 of 2 20172016 2015 Assets Current assets Long-tern investments Plant assets, net Total assets Liabilities and Equity Current liabilities Common stock Other paid-in capital Retained earnings Total liabilities and equity $ 52, 390 37,924 51,748 3,950 100,00096,00060,000 500 points s 22,800 $ 19,960 $ 20, 300 72,000 72, 000 60,000 6, 000 eBook Ask Print References 9, 000 9, 000 48.590 33,464 83:46429.398 $152, 390 $134,424 $115, 698 2. Complete the below table to calculate income statement data in common-size percents. (Round your percentage answers to 2 decimal places.) 2. Complete the below table to calculate income statement data in common-si decimal places.) KORBIN COMPANY Common-Size Comparative Income Statements For Years Ended December 31, 2017, 2016, and 2015 2017 2016 2015 Sales Cost of goods sold Gross profit Selling expenses Administrative expenses Total expenses Income before taxes Income taxes Net income Chec 14 KORBIN COMPANY Comparative Balance Sheets December 31, 2017, 2016, n5 Part 1 of 2 20172016 2015 Assets Current assets Long-tern investments Plant assets, net Total assets Liabilities and Equity Current liabilities Common stock Other paid-in capital Retained earnings Total liabilities and equity $ 52, 390 37,924 51,748 3,950 100,00096,00060,000 500 points s 22,800 $ 19,960 $ 20, 300 72,000 72, 000 60,000 6, 000 eBook Ask Print References 9, 000 9, 000 48.590 33,464 83:46429.398 $152, 390 $134,424 $115, 698 2. Complete the below table to calculate income statement data in common-size percents. (Round your percentage answers to 2 decimal places.) 2. Complete the below table to calculate income statement data in common-si decimal places.) KORBIN COMPANY Common-Size Comparative Income Statements For Years Ended December 31, 2017, 2016, and 2015 2017 2016 2015 Sales Cost of goods sold Gross profit Selling expenses Administrative expenses Total expenses Income before taxes Income taxes Net income