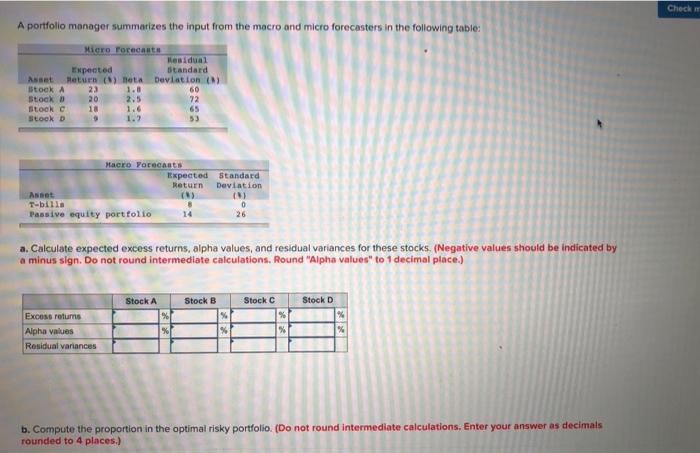
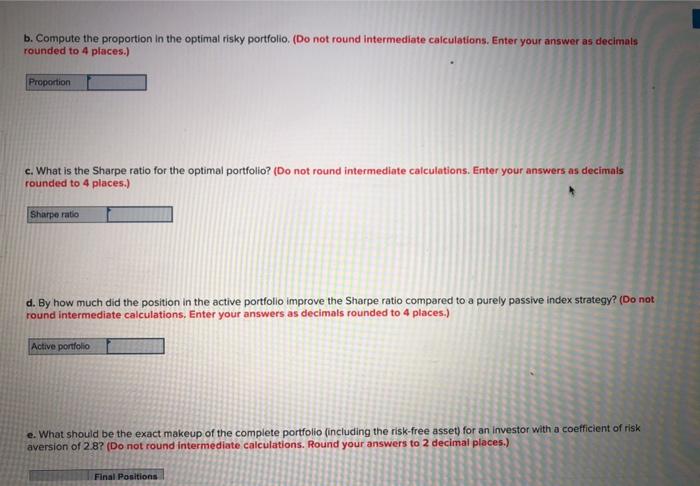
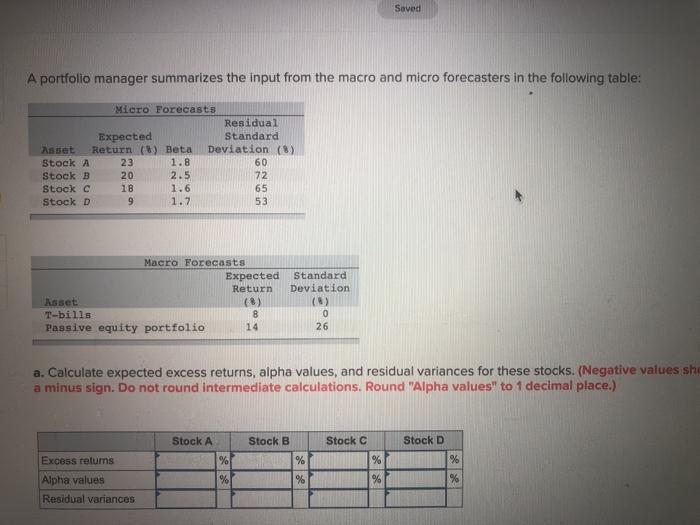
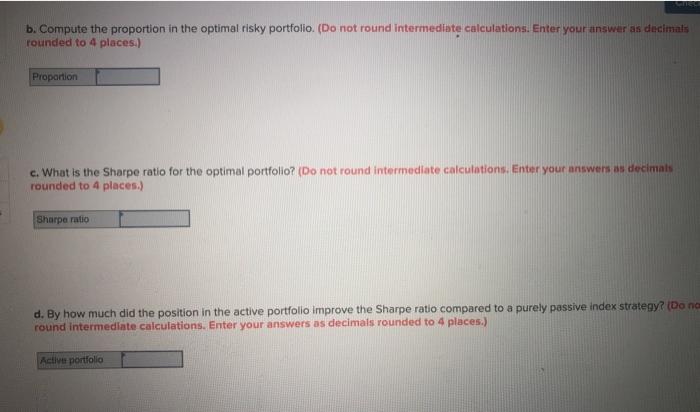
Check A portfolio manager summarizes the input from the macro and micro forecasters in the following table: Micro Forecast Residual Expected Standard AssetReturn eta Deviation took A 23 60 Stock 20 2.5 72 Stook c 18 1.6 65 Stock D 1.2 33 Macro Forecast Expected Standard Return Deviation Asset (N) ( T-billa 0 Passive equity portfolio 26 a. Calculate expected excess returns, alpha values, and residual variances for these stocks. (Negative values should be indicated by a minus sign. Do not round intermediate calculations, Round "Alpha values" to 1 decimal place.) Stock A Stock B Stock Stock D Excess returns Alpha values Residual variances b. Compute the proportion in the optimal risky portfolio. (Do not round intermediate calculations. Enter your answer as decimals rounded to 4 places.) b. Compute the proportion in the optimal risky portfolio. (Do not round intermediate calculations. Enter your answer as decimals rounded to 4 places.) Proportion c. What is the Sharpe ratio for the optimal portfolio? (Do not round intermediate calculations. Enter your answers as decimals rounded to 4 places.) Sharpe ratio d. By how much did the position in the active portfolio improve the Sharpe ratio compared to a purely passive index strategy? (Do not round intermediate calculations. Enter your answers as decimals rounded to 4 places.) Active portfolio e. What should be the exact makeup of the complete portfolio (including the risk-free asset) for an investor with a coefficient of risk aversion of 28? (Do not round Intermediate calculations. Round your answers to 2 decimal places.) Final Positions d. By how much did the position in the active portfolio improve the Sharpe ratio compared to a purely possive index strategy? (Do not round intermediate calculations. Enter your answers as decimals rounded to 4 places.) Active portfolio e. What should be the exact makeup of the complete portfolio (including the risk free asset) for an investor with a coefficient of risk aversion of 2.8? (Do not round intermediate calculations. Round your answers to 2 decimal places.) Final Positions |BRls M A % B % % D Total % % Saved A portfolio manager summarizes the input from the macro and micro forecasters in the following table: Micro Forecasts Residual Expected Standard Anset Return (8) Beta Deviation (8) Stock A 23 1.8 60 Stock B 20 2.5 72 Stock C 18 1.6 65 Stock D 9 1.7 53 Macro Forecasts Expected Return Asset. (8) T-bills 8 Passive equity portfolio 14 Standard Deviation (8) 0 26 a. Calculate expected excess returns, alpha values, and residual variances for these stocks. (Negative values she a minus sign. Do not round Intermediate calculations. Round "Alpha values" to 1 decimal place.) Stock B Stock C Stock A % % Stock D % Excess retums Alpha values Residual variances % % % % b. Compute the proportion in the optimal risky portfolio. (Do not round intermediate calculations. Enter your answer as decimals rounded to 4 places) Proportion c. What is the Sharpe ratio for the optimal portfolio? (Do not round intermediate calculations. Enter your answers as decimals rounded to 4 places.) Sharpe ratio d. By how much did the position in the active portfolio improve the Sharpe ratio compared to a purely passive index strategy? (Do na round intermediate calculations. Enter your answers as decimals rounded to 4 places.) Active portfolio e. What should be the exact makeup of the complete portfolio (including the risk-free asset) for an investor with a coefficient of risk aversion of 2.87 (Do not round intermediate calculations. Round your answers to 2 decimal places.) Final Positions 96 Bills M A % % % B C D Total % % %