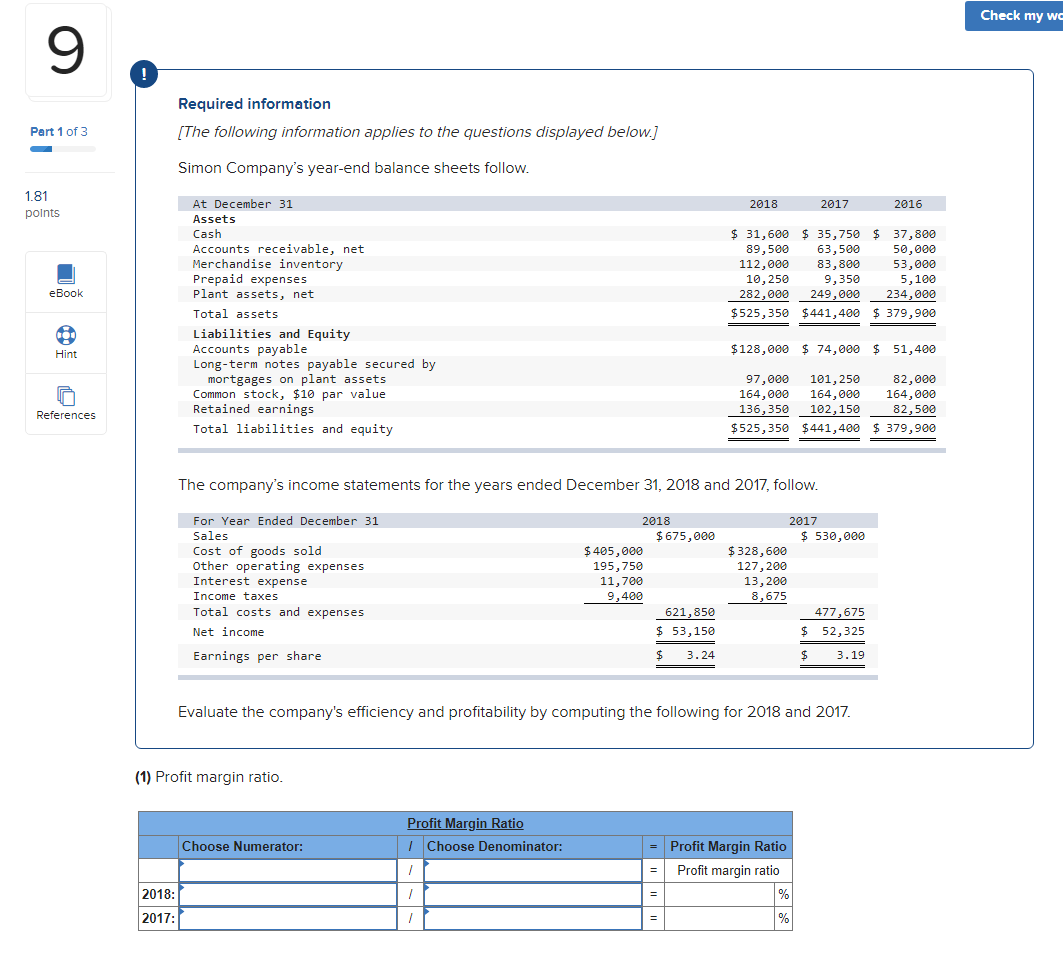
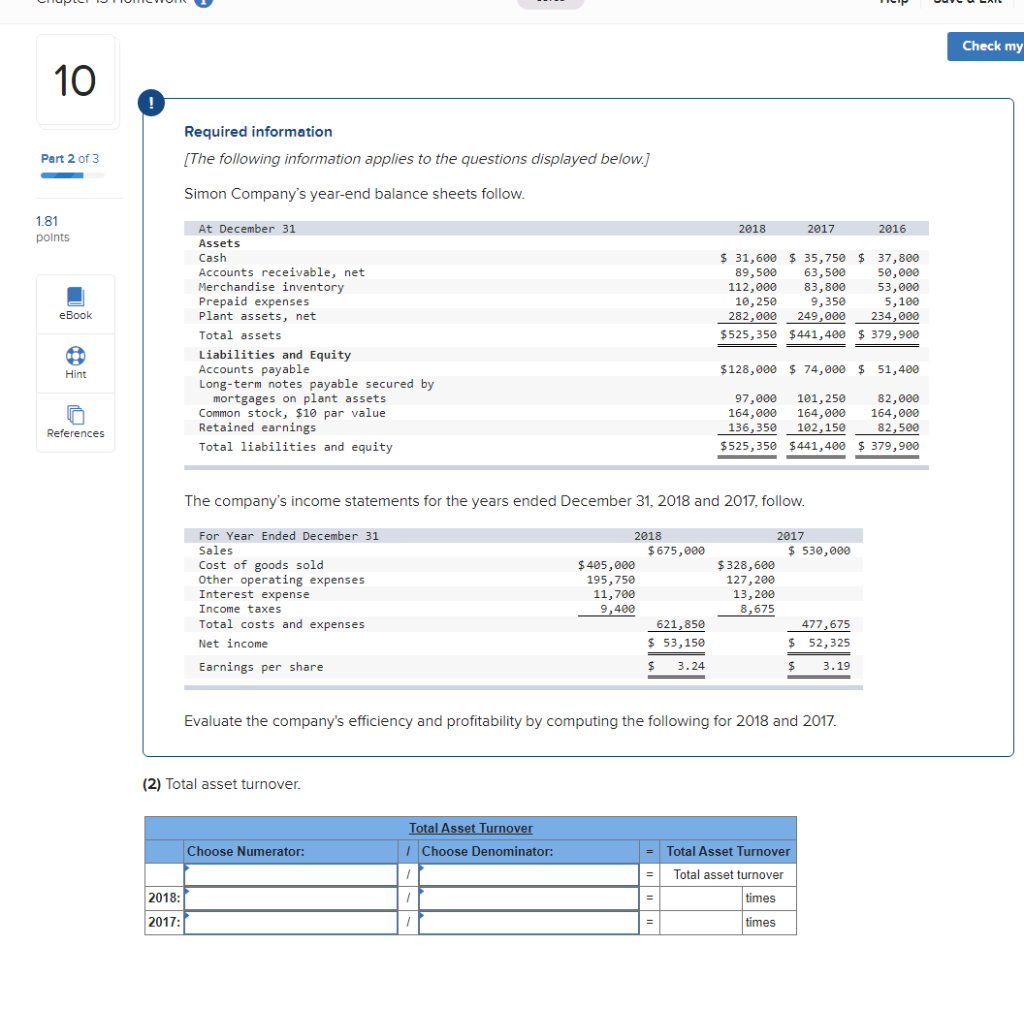
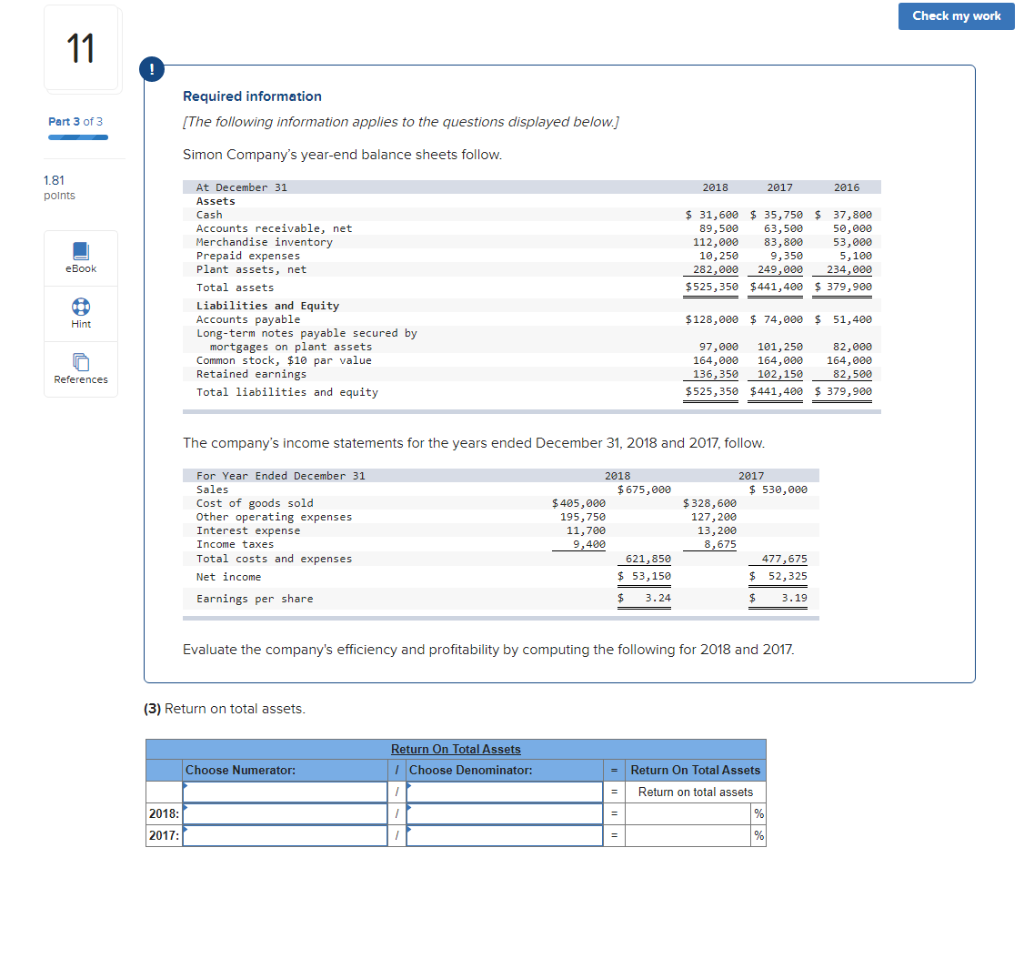
Check my wc Part 1 of 3 Required information (The following information applies to the questions displayed below. Simon Company's year-end balance sheets follow. 1.81 points 2018 2017 2016 At December 31 Assets Cash Accounts receivable, net Merchandise inventory Prepaid expenses Plant assets, net Total assets Liabilities and Equity Accounts payable Long-term notes payable secured by mortgages on plant assets Common stock, $10 par value Retained earnings Total liabilities and equity $ 31,600 $ 35,750 $ 37,800 89,500 63,500 50,000 112,000 83,800 53,000 10,250 9,350 5,100 282,000 249,000 234,000 $525,350 $441,400 $ 379,900 eBook Hint $128,000 $ 74,000 $ 51,400 97,000 101,250 82,000 164,000 164,000 164,000 136,350 102,150 82,500 $525,350 $441,400 $ 379,900 References The company's income statements for the years ended December 31, 2018 and 2017, follow. For Year Ended December 31 Sales Cost of goods sold Other operating expenses Interest expense Income taxes Total costs and expenses Net income Earnings per share 2018 $675,000 $ 405,000 195,750 11,700 9,400 621,850 $ 53,150 2017 $ 530,000 $328,600 127,200 13,200 8,675 477,675 $ 52,325 $ 3.24 $ 3.19 Evaluate the company's efficiency and profitability by computing the following for 2018 and 2017. (1) Profit margin ratio. Profit Margin Ratio | Choose Denominator: Choose Numerator: = Profit Margin Ratio Profit margin ratio % 2018: 2017:1 = % Check my 10 Required information [The following information applies to the questions displayed below.] Part 2 of 3 Simon Company's year-end balance sheets follow. 1.81 points 2018 2017 2016 At December 31 Assets Cash Accounts receivable, net Merchandise inventory Prepaid expenses Plant assets, net Total assets Liabilities and Equity Accounts payable Long-term notes payable secured by mortgages on plant assets Common stock, $10 par value Retained earnings Total liabilities and equity $ 31,600 $ 35,750 $ 37,800 89,500 63,500 50,000 112,000 83,800 53,000 10, 250 9,350 5,100 282,000 249,000 234,000 $525,350 $441,400 $ 379,900 eBook Cod Hint $128,000 $ 74,000 $ 51,400 97,000 101,250 82,000 164,000 164,000 164,000 136, 350 102,150 82,500 $525,350 $441,400 $ 379,900 References The company's income statements for the years ended December 31, 2018 and 2017, follow. For Year Ended December 31 Sales Cost of goods sold Other operating expenses Interest expense Income taxes Total costs and expenses Net income Earnings per share 2018 $675,000 $405,000 195,750 11,700 9,400 621,850 $ 53,150 3.24 2017 $ 530,000 $328,600 127,200 13,200 8,675 477,675 $ 52,325 $ 3.19 Evaluate the company's efficiency and profitability by computing the following for 2018 and 2017. (2) Total asset turnover. Total Asset Turnover 1 Choose Denominator: Choose Numerator: Total Asset Turnover Total asset turnover times 2018: 2017: times Check my work 11 Required information [The following information applies to the questions displayed below.] Part 3 of 3 Simon Company's year-end balance sheets follow. 1.81 points 2018 2017 2016 At December 31 Assets Cash Accounts receivable, net Merchandise inventory Prepaid expenses Plant assets, net Total assets Liabilities and Equity Accounts payable Long-term notes payable secured by mortgages on plant assets Common stock, $10 par value Retained earnings Total liabilities and equity $ 31,600 $ 35,750 $ 37,800 89,500 63,500 50,000 112,000 83,800 53,000 10, 250 9,350 5,100 282,000 249,000 234,000 $525,350 $441,400 $ 379,900 eBook Hint $ 128,000 $ 74,000 $ 51,400 97,000 101,250 82,000 164,000 164,000 164,000 136,350 102,150 82,500 $525,350 $441,400 $ 379,900 References The company's income statements for the years ended December 31, 2018 and 2017, follow. For Year Ended December 31 Sales Cost of goods sold Other operating expenses Interest expense Income taxes Total costs and expenses Net income Earnings per share 2018 $675,000 $405,000 195,750 11,700 9,400 621,850 $ 53,150 2017 $ 530,000 $328,600 127,200 13,200 8,675 477,675 $ 52,325 $ 3.24 $ 3.19 Evaluate the company's efficiency and profitability by computing the following for 2018 and 2017 (3) Return on total assets. Return On Total Assets Choose Denominator: Choose Numerator: = Return On Total Assets Return on total assets % % 2018: 2017