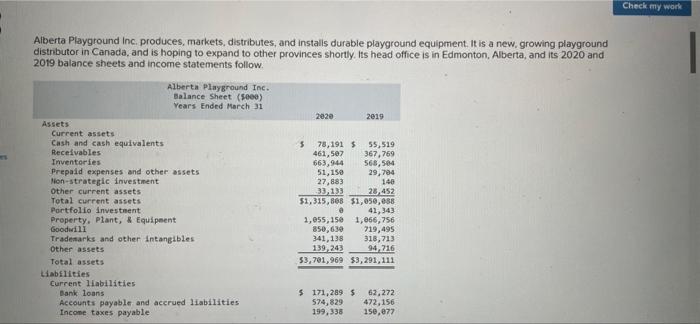
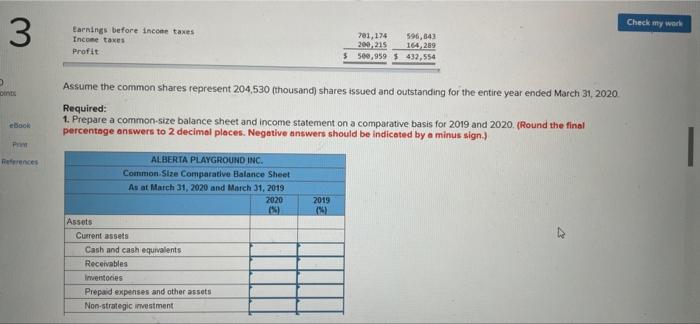
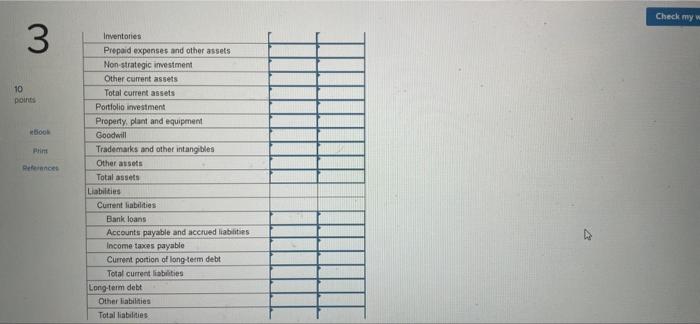
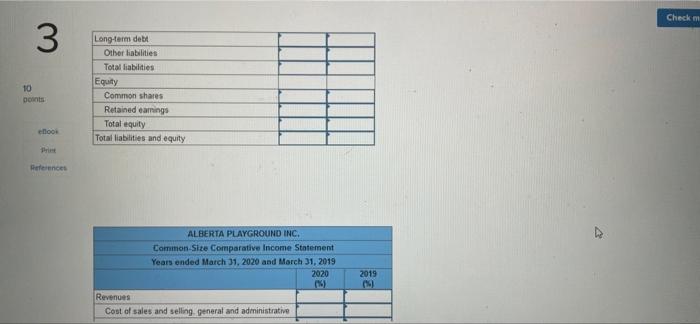
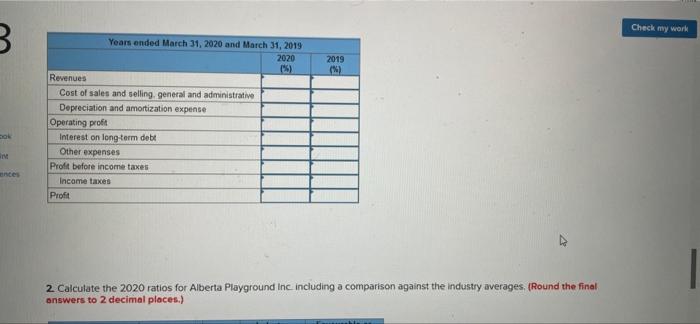
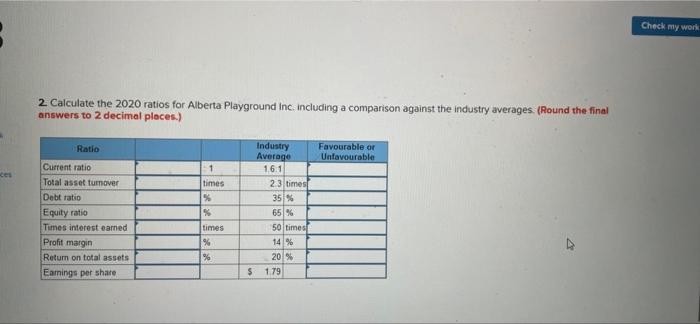
Check my work Alberta Playground Inc. produces, markets, distributes, and installs durable playground equipment. It is a new, growing playground distributor in Canada, and is hoping to expand to other provinces shortly. Its head office is in Edmonton, Alberta, and its 2020 and 2019 balance sheets and income statements follow Alberta Playground Inc. Balance Sheet (5000) Years Ended March 31 2020 2019 Assets Current assets Cash and cash equivalents Receivables Inventories Prepaid expenses and other assets Non-strategic investment Other current assets Total current assets Portfolio Investment Property. Plant, & Equipment Goodwill Trademarks and other intangibles Other assets Total assets Liabilities Current liabilities Bank loans Accounts payable and accrued liabilities Income taxes payable 5 78,191 $ 55,519 461,5e7 367,769 663,944 568,504 51,150 29,704 27,883 146 33,133 28,452 $1,315,308 $1,050,688 42,343 1,055,150 1,866,756 850,63 719,495 341,138 318,713 139,243 94,216 53,781,969 $3,291,111 5 171,289 $ 574,829 199, 338 62,272 472,156 150,877 Check 3 30 points Bank loans Accounts payable and accrued liabilities Income taxes payable Current portion of long tere debt Total current liabilities Non-Current Liabilities Long-term debt Other liabilities Total liabilities Equity Connon shares Retained earnings Total equity Total liabilities and equity 5 171,2895 62,272 574,029 472,156 199,338 350,077 28,339 8,779 $ 973,795 5693,284 379,850 362,190 189,683 154.069 $1,543,358 $1,229,543 $ 624,675 5 591,749 1,533,936 1,469,619 $2.158,611 52,061, 568 $3,701,969 53,291,111 eboo Print Alberto Playground Inc. Income Statement (5000) Years Ended March 31 Revenues Cost of sales, selling and administrative expenses Depreciation and mortization expense Operating profit Interest on long-term debt Other expenses Earnings before income taxes Income taxes Profit 2020 2019 56,095,470 $5,880,582 5,249,330 5,132,511 106.582 115, 256 739,558 632,815 23,421 30, 111 1496) 5,861 701, 174 596.843 200,215 164.289 500,959 $ 432,554 Check my work 3 Earnings before income taxes Income taxes Profit 701, 174 596,643 200,215 164209 500,959 $ 432,554 On Assume the common shares represent 204,530 (thousand) shares issued and outstanding for the entire year ended March 31, 2020 Required: 1. Prepare a common-size balance sheet and income statement on a comparative basis for 2019 and 2020. (Round the final percentage answers to 2 decimal places. Negative answers should be indicated by a minus sign.) ebook Paint References ALBERTA PLAYGROUND INC. Common Size Comparative Balance Sheet As at March 31, 2020 and March 31, 2019 2020 2019 (2 Assets Current assets Cash and cash equivalents Receivables Inventores Prepaid expenses and other assets Non-strategic investment Check my 3 10 points book Print References Inventories Prepaid expenses and other assets Non strategic investment Other current assets Total current assets Portfolio investment Property, plant and equipment Goodwill Trademarks and other intangibles Other assets Total assets Liabilities Current liabilities Bank loans Accounts payable and accrued liabilities Income taxes payable Current portion of long-term debt Total current liabilities Long-term debt Other liabilities Total liabilities Checkm 3 10 points Long-term debit Other liabilities Total liabilities Equity Common shares Retained earrings Total equity Total liabilities and equity oor Print References ALBERTA PLAYGROUND INC. Common Size Comparative Income Statement Years onded March 31, 2020 and March 31, 2019 2020 2019 Revenues Cost of sales and selling general and administrative Check my work 3 2019 (%) Years ended March 31, 2020 and March 31, 2019 2020 1) Revenues Cost of sales and selling general and administrative Depreciation and amortization expense Operating profit Interest on long-term debe Other expenses Profit before income taxes Income taxes Profit antes 2 Calculate the 2020 ratios for Alberta Playground Inc including a comparison against the Industry averages (Round the final answers to 2 decimal places.) Check my work 2. Calculate the 2020 ratios for Alberta Playground Inc. including a comparison against the industry averages. (Round the final answers to 2 decimal places.) Ratio Favourable or Unfavourable times % Current ratio Total asset tumover Debt ratio Equity ratio Times interest eamed Profit margin Return on total assets Earnings per share Industry Average 16.1 23 times 35% 65% 50 times 14% 20 % $ 179 times % %