Chem 1200 Kinetics Part 2 and 3 Post Lab Questions

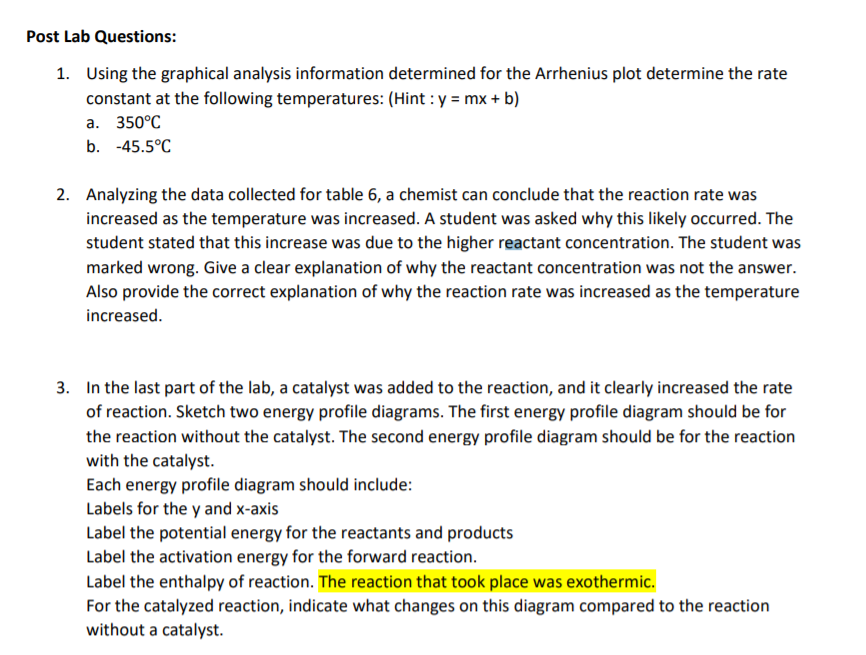
Post Lab Questions: 1. Using the graphical analysis information determined for the Arrhenius plot determine the rate constant at the following temperatures: (Hint: y = mx + b) a. 350C b. -45.5C 2. Analyzing the data collected for table 6, a chemist can conclude that the reaction rate was increased as the temperature was increased. A student was asked why this likely occurred. The student stated that this increase was due to the higher reactant concentration. The student was marked wrong. Give a clear explanation of why the reactant concentration was not the answer. Also provide the correct explanation of why the reaction rate was increased as the temperature increased. 3. In the last part of the lab, a catalyst was added to the reaction, and it clearly increased the rate of reaction. Sketch two energy profile diagrams. The first energy profile diagram should be for the reaction without the catalyst. The second energy profile diagram should be for the reaction with the catalyst. Each energy profile diagram should include: Labels for the y and x-axis Label the potential energy for the reactants and products Label the activation energy for the forward reaction. Label the enthalpy of reaction. The reaction that took place was exothermic. For the catalyzed reaction, indicate what changes on this diagram compared to the reaction without a catalyst. Post Lab Questions: 1. Using the graphical analysis information determined for the Arrhenius plot determine the rate constant at the following temperatures: (Hint: y = mx + b) a. 350C b. -45.5C 2. Analyzing the data collected for table 6, a chemist can conclude that the reaction rate was increased as the temperature was increased. A student was asked why this likely occurred. The student stated that this increase was due to the higher reactant concentration. The student was marked wrong. Give a clear explanation of why the reactant concentration was not the answer. Also provide the correct explanation of why the reaction rate was increased as the temperature increased. 3. In the last part of the lab, a catalyst was added to the reaction, and it clearly increased the rate of reaction. Sketch two energy profile diagrams. The first energy profile diagram should be for the reaction without the catalyst. The second energy profile diagram should be for the reaction with the catalyst. Each energy profile diagram should include: Labels for the y and x-axis Label the potential energy for the reactants and products Label the activation energy for the forward reaction. Label the enthalpy of reaction. The reaction that took place was exothermic. For the catalyzed reaction, indicate what changes on this diagram compared to the reaction without a catalyst


