Question
(a) The absorption spectrum of the HCL molecule is shown in Figure 1. Explain the reason gap occur between the two sets of the

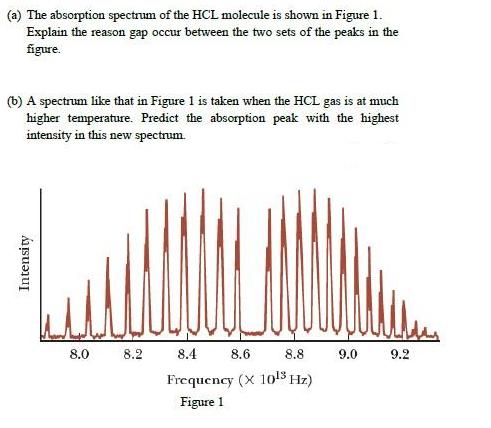
(a) The absorption spectrum of the HCL molecule is shown in Figure 1. Explain the reason gap occur between the two sets of the peaks in the figure. (b) A spectrum like that in Figure 1 is taken when the HCL gas is at much higher temperature. Predict the absorption peak with the highest intensity in this new spectrum. 8.0 8.2 8.4 8.6 8.8 9.0 9.2 Frequency (X 1o!5 Hz) Figure 1 Intensity
Step by Step Solution
3.42 Rating (155 Votes )
There are 3 Steps involved in it
Step: 1
1 A classic among molecular spectra the infrared absorption spectrum of HCl can be analyzed to gain information about both rotation and vibration of the molecule The absorption lines shown involve tra...
Get Instant Access to Expert-Tailored Solutions
See step-by-step solutions with expert insights and AI powered tools for academic success
Step: 2

Step: 3

Ace Your Homework with AI
Get the answers you need in no time with our AI-driven, step-by-step assistance
Get StartedRecommended Textbook for
Modern Control Systems
Authors: Richard C. Dorf, Robert H. Bishop
12th edition
136024580, 978-0136024583
Students also viewed these Chemistry questions
Question
Answered: 1 week ago
Question
Answered: 1 week ago
Question
Answered: 1 week ago
Question
Answered: 1 week ago
Question
Answered: 1 week ago
Question
Answered: 1 week ago
Question
Answered: 1 week ago
Question
Answered: 1 week ago
Question
Answered: 1 week ago
Question
Answered: 1 week ago
Question
Answered: 1 week ago
Question
Answered: 1 week ago
Question
Answered: 1 week ago
Question
Answered: 1 week ago
Question
Answered: 1 week ago
Question
Answered: 1 week ago
Question
Answered: 1 week ago
Question
Answered: 1 week ago
Question
Answered: 1 week ago
Question
Answered: 1 week ago
Question
Answered: 1 week ago
View Answer in SolutionInn App


