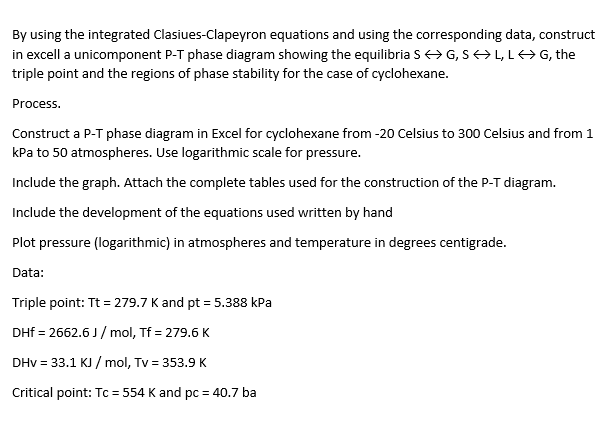
By using the integrated Clasiues-Clapeyron equations and using the corresponding data, construct in excell a unicomponent P-T phase diagram showing the equilibria S G,
By using the integrated Clasiues-Clapeyron equations and using the corresponding data, construct in excell a unicomponent P-T phase diagram showing the equilibria S G, SL, L G, the triple point and the regions of phase stability for the case of cyclohexane. Process. Construct a P-T phase diagram in Excel for cyclohexane from -20 Celsius to 300 Celsius and from 1 kPa to 50 atmospheres. Use logarithmic scale for pressure. Include the graph. Attach the complete tables used for the construction of the P-T diagram. Include the development of the equations used written by hand Plot pressure (logarithmic) in atmospheres and temperature in degrees centigrade. Data: Triple point: Tt = 279.7 K and pt = 5.388 kPa DHF = 2662.6J/mol, Tf = 279.6 K DHv = 33.1 KJ/mol, Tv = 353.9 K Critical point: Tc = 554 K and pc = 40.7 ba
Step by Step Solution
3.45 Rating (164 Votes )
There are 3 Steps involved in it
Step: 1
solidliquid A Phase diagram combines plots of pressure versus temperature for the liquidgas and soli...
See step-by-step solutions with expert insights and AI powered tools for academic success
Step: 2

Step: 3

Ace Your Homework with AI
Get the answers you need in no time with our AI-driven, step-by-step assistance
Get Started


