Question
Cheri Wallis, Director of MBA Admissions at Piedmont Business School, was desperate.The first faculty meeting of the fall was scheduled to start in less than
Cheri Wallis, Director of MBA Admissions at Piedmont Business School, was desperate.The first faculty meeting of the fall was scheduled to start in less than an hour, and Valarie Zinfandel, marketing professor, gourmet cook, and Associate Dean of MBA Administrivia, was hounding Wallis to provide some data on the entering MBA class.Zinfandel had heard rumors that many other faculty members were vying for the Administrivia position, so she wanted to make herself look as good as possible.
Zinfandel knew that last year's MBA class had GPA's which were normally distributed, with a mean of 3.25 and a standard deviation of 0.35.Since Piedmont admits everyone, you may assume that their MBA classes have an infinite number of students.
Zinfandel wanted similar information from Wallis on this year's class.She was hoping to use Wallis' admissions success to hold on to her own job and to make a better argument for an increased budget. Zinfandel said she needed information on the average GPA of the new class, the average GMAT, and on the percent of the class that was female.(Zinfandel was bright enough to figure out the percent of the class that was male from this information.)
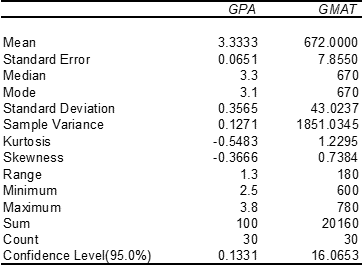
Wallis was about to tell Zinfandel that there wasn't time to obtain the information that was wanted when she spied a stack of admissions folders in the corner of her office.Earlier that week she had been training her staff on how to process admissions data, and had randomly selected a group of 30 students from the new MBA class.She turned to Excel and quickly created columns of data for these students' GPA and GMAT scores.She then created the following output using Excel's Descriptive Statistics Data Analysis Tool.She also noted that 6 of the students were female.

Step by Step Solution
There are 3 Steps involved in it
Step: 1

Get Instant Access to Expert-Tailored Solutions
See step-by-step solutions with expert insights and AI powered tools for academic success
Step: 2

Step: 3

Ace Your Homework with AI
Get the answers you need in no time with our AI-driven, step-by-step assistance
Get Started


