Chester Corp. ended the year carrying $23,495,000 worth of inventory. Had they sold their entire inventory at their current prices, how much more revenue would it have brought to Chester Corp.?
Select: 1
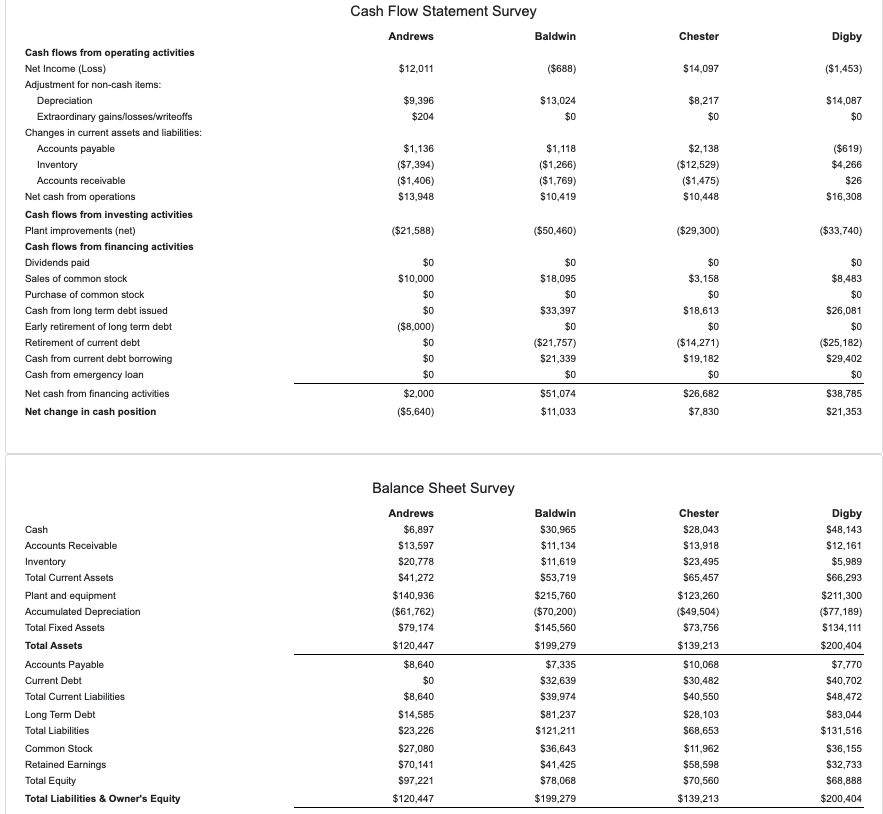
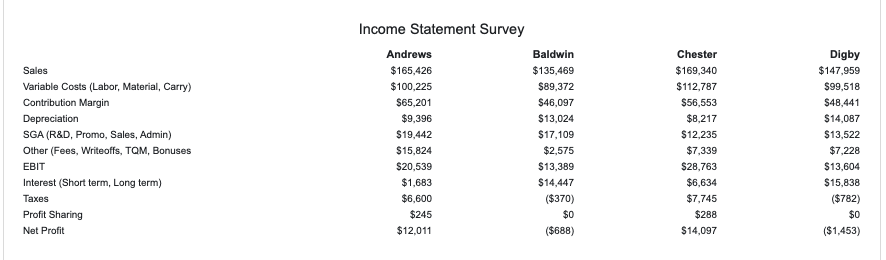
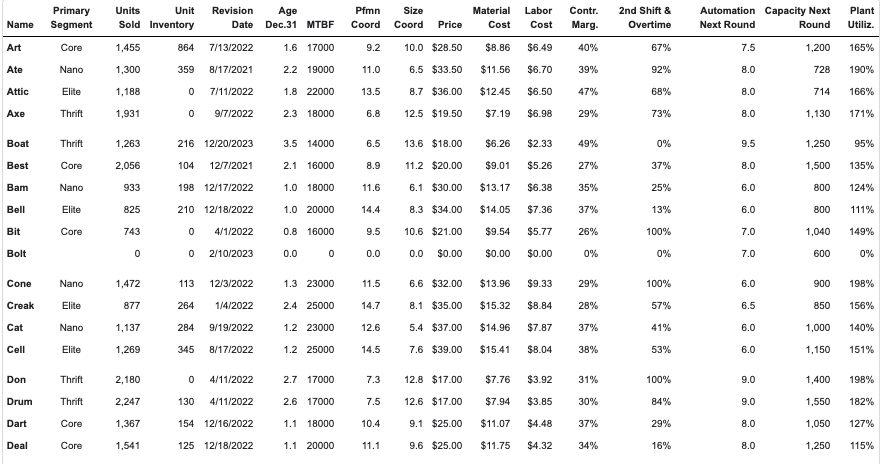
Cash Flow Statement Survey Andrews Baldwin Chester Digby $12,011 ($688) $14,097 ($1,453) $9,396 $204 $13,024 $0 $8,217 $0 $14,087 $0 ($619) $4,266 $1,136 ($7,394) ($1,406) $13,948 $1,118 ($1,266) ($1.769) $10.419 $2,138 ($12,529) ($1,475) $10,448 $26 $16,308 Cash flows from operating activities Net Income (Loss) Adjustment for non-cash items: Depreciation Extraordinary gains/losses/writeoffs Changes in current assets and liabilities: Accounts payable Inventory Accounts receivable Net cash from operations Cash flows from investing activities Plant improvements (net) Cash flows from financing activities Dividends paid Sales of common stock Purchase of common stock Cash from long term debt issued Early retirement of long term debt Retirement of current debt Cash from current debt borrowing Cash from emergency loan Net cash from financing activities Net change in cash position ($21,588) ($50,460) ($29,300) ($33,740) $0 $10,000 $0 $0 ($8,000) $0 $0 $0 $0 $18,095 $0 $33,397 $0 ($21,757) $21,339 $0 $0 $3,158 $0 $18,613 $0 ($14,271) $19,182 $0 $0 $8,483 $0 $26,081 $0 ($25,182) $29,402 $0 $38,785 $2,000 ($5,640) $51,074 $11,033 $26,682 $7,830 $21,353 Balance Sheet Survey Chester $28,043 $13,918 $23,495 $65,457 $123,260 ($49,504) $73,756 $139,213 Cash Accounts Receivable Inventory Total Current Assets Plant and equipment Accumulated Depreciation Total Fixed Assets Total Assets Accounts Payable Current Debt Total Current Liabilities Long Term Debt Total Liabilities Common Stock Retained Earnings Total Equity Total Liabilities & Owner's Equity Andrews $6,897 $13,597 $20,778 $41,272 $140,936 ($61,762) $79,174 $120,447 $8,640 $0 $8,640 $14,585 $23,226 $27,080 $70,141 $97,221 $120,447 Baldwin $30,965 $11,134 $11,619 $53,719 $215,760 ($70,200) $145,560 $199,279 $7,335 $32,639 $39,974 $81,237 $121,211 $36,643 $41,425 $78,068 $199.279 Digby $48,143 $12,161 $5,989 $66,293 $211,300 ($77,189) $134 111 $200,404 $7.770 $40,702 $48,472 $83,044 $131,516 $36,155 $32,733 $68,888 $200,404 $10,068 $30,482 $40,550 $28,103 $68,653 $11.962 $58,598 $70,560 $139,213 Sales Variable Costs (Labor, Material, Carry) Contribution Margin Depreciation SGA (R&D, Promo, Sales, Admin) Other (Fees, Writeoffs, TOM, Bonuses EBIT Interest (Short term, Long term) Taxes Profit Sharing Net Profit Income Statement Survey Andrews $165,426 $100,225 $65,201 $9,396 $19,442 $15,824 $20,539 $1,683 $6,600 $245 $12,011 Baldwin $135,469 $89,372 $46,097 $13,024 $17,109 $2,575 $13,389 $14,447 ($370) $0 ($688) Chester $169,340 $112,787 $56,553 $8,217 $12,235 $7,339 $28,763 $6,634 $7,745 $288 $14,097 Digby $147,959 $99,518 $48,441 $14,087 $13,522 $7,228 $13,604 $15,838 ($782) $0 ($1,453) Pfmn Primary Segment Revision Date Age Dec.31 MTBF Size Coord Material Cost Labor Cost Units Unit Sold Inventory 1,455 864 2nd Shift & Overtime Name Automation Capacity Next Next Round Round Plant Utiliz. Contr. Marg. Coord Price Art Core 7/13/2022 1.6 17000 9.2 10.0 $28.50 $8.86 $6.49 40% 67% 7.5 1,200 165% Ate Nano 1,300 359 8/17/2021 2.2 19000 11.0 6.5 $33.50 $11.56 $6.70 39% 92% 8.0 728 190% Attic Elite 1,188 0 7/11/2022 1.8 22000 13.5 8.7 $36.00 $12.45 $6.50 47% 68% 8.0 714 166% Axe Thrift 1,931 0 9/7/2022 2.3 18000 6.8 12.5 $19.50 $7.19 $6.98 29% 73% 8.0 1,130 171% Boat Thrift 1,263 216 12/20/2023 3.5 14000 6.5 13.6 $18.00 $6.26 $2.33 49% 0% 9.5 1,250 95% Best Core 2,056 104 12/7/2021 2.1 16000 8.9 11.2 $20.00 $9.01 $5.26 27% 37% 8.0 1,500 135% Bam Nano 933 198 12/17/2022 1.0 18000 11.6 6.1 $30.00 $13.17 $6.38 35% 25% 6.0 800 124% Bell Elite 825 210 12/18/2022 1.0 20000 14.4 8.3 $34.00 $14.05 $7.36 37% 13% 6.0 800 111% Bit Core 743 4/1/2022 0.8 16000 9.5 10.6 $21.00 $9.54 $5.77 100% 7.0 1,040 149% Bolt 0 0 2/10/2023 0.0 0 0.0 0.0 $0.00 $0.00 $0.00 0% 0% 7.0 600 0% Cone Nano 1,472 113 12/3/2022 1.3 23000 11.5 6.6 $32.00 $13.96 $9.33 29% 100% 6.0 900 198% Creak Elite 877 264 1/4/2022 2.4 25000 14.7 8.1 $35.00 $15.32 $8.84 28% 57% 6.5 850 156% Cat Nano 1,137 284 9/19/2022 1.2 23000 12.6 5.4 $37.00 $14.96 $7.87 37% 41% 6.0 1,000 140% Cell Elite 1,269 345 8/17/2022 1.2 25000 14.5 7.6 $39.00 $15.41 $8.04 38% 53% 6.0 1,150 151% Don Thrift 2,180 0 4/11/2022 2.7 17000 7.3 12.8 $17.00 $7.76 $3.92 31% 100% 9.0 1,400 198% Drum Thrift 2,247 130 4/11/2022 2.6 17000 7.5 12.6 $17.00 $7.94 $3.85 30% 84% 9.0 1,550 182% Dart Core 1,367 154 12/16/2022 1.1 18000 10.4 9.1 $25.00 $11.07 $4.48 37% 29% 8.0 1,050 127% Deal Core 1,541 125 12/18/2022 1.1 20000 11.1 9.6 $25.00 $11.75 $4.32 34% 16% 8.0 1,250 115%