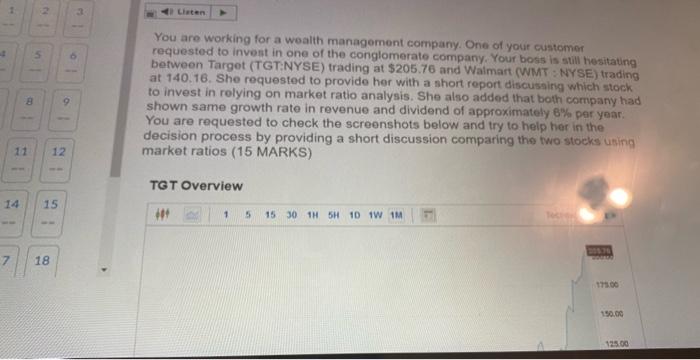
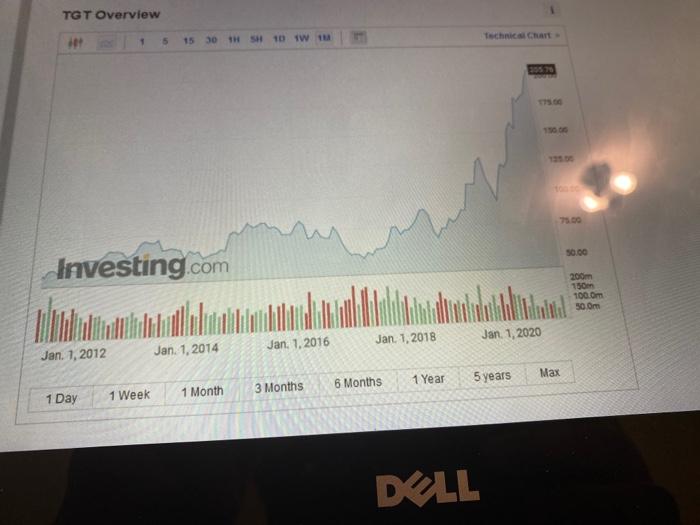
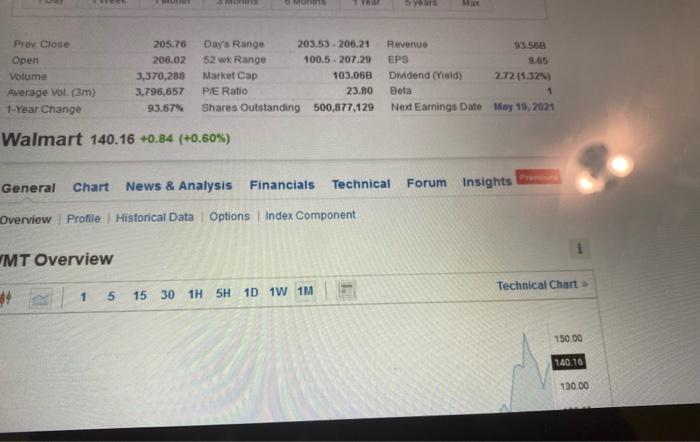
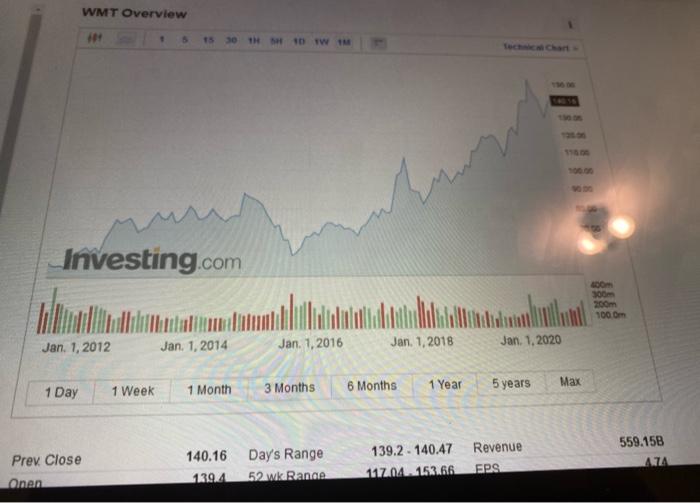
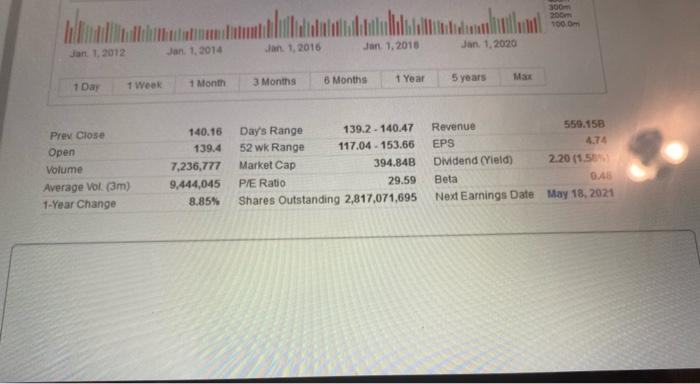
Cheten 5 You are working for a wealth management company. One of your customer requested to invest in one of the conglomerate company. Your boss is still hesitating between Target (TGT:NYSE) trading at $205.76 and Walmart (WMT: NYSE) trading at 140.18. She requested to provide her with a short report discussing which stock to invest in relying on market ratio analysis. She also added that both company had shown same growth rate in revenue and dividend of approximately 6% per year. You are requested to check the screenshots below and try to help her in the decision process by providing a short discussion comparing the two stocks using market ratios (15 MARKS) 8 9 12 TGT Overview 15 1 5 15 301H5H 10 1W 1M 7 18 150.00 125.09 TGT Overview 1 Technical Chart 5 15 30 SH 10 W 30573 50.00 Investing.com 200m 150m 100 m 50.0m Jan 1, 2018 Jan 1, 2020 Jan. 1.2016 Jan 1, 2012 Jan 1, 2014 Max 1 Year 5 years 6 Months 3 Months 1 Month 1 Day 1 Week DELL mon ME Prev Close Open Volume Average Vol.(3m) 1-Year Change 205.76 206.02 3,370,288 3,796,657 93.67% Day's Range 203.53 206.21 52 wk Range 100.5.207.29 Market Cap 103.05B P/E Ratio 23.80 Shares Outstanding 500,877,129 Revenue 93.560 EPS Didend (Yield) 2.12(1.32) Beta 1 Next Earnings Date May 19, 2021 Walmart 140.16 +0.84 (+0.60%) General Chart News & Analysis Financials Technical Forum Insights from Overview Profile Historical Data Options Index Component MT Overview Technical Chart 5 15 30 1H 5H 1D 1W 1M 150.00 140.16 130.00 WMT Overview 1530th 10W m Investing.com 400m 300m 1000 Jan 1, 2012 Jan 1, 2014 Jan 1, 2016 Jan. 1. 2018 Jan 1, 2020 1 Day 1 Week Max 1 Month 3 Months 1 Year 5 years 6 Months 140.16 139.4 Prev. Close Day's Range 52 Rance 139.2.140.47 117.04.153.66 559.15B AZA Revenue EPS Onan 300 100 m Jan 1, 2018 Jan 1, 2012 Jan 1, 2016 Jan. 1.2020 Jan 1, 2014 1 Year 5 years 6 Months Max 1 Day 1 Week 3 Months 1 Month Prev Close Open Volume Average vol (3) 1-Year Change 140.16 139.4 7,236,777 9,444,045 8.85% Day's Range 139.2 - 140.47 52 wk Range 117.04.153.66 Market Cap 394.84B P/E Ratio 29.59 Shares Outstanding 2,817,071,695 Revenue 559.15B EPS 4.74 Dividend (Yield) 2.20 (1.50 Beta 0.45 Next Earnings Date May 18, 2021 Cheten 5 You are working for a wealth management company. One of your customer requested to invest in one of the conglomerate company. Your boss is still hesitating between Target (TGT:NYSE) trading at $205.76 and Walmart (WMT: NYSE) trading at 140.18. She requested to provide her with a short report discussing which stock to invest in relying on market ratio analysis. She also added that both company had shown same growth rate in revenue and dividend of approximately 6% per year. You are requested to check the screenshots below and try to help her in the decision process by providing a short discussion comparing the two stocks using market ratios (15 MARKS) 8 9 12 TGT Overview 15 1 5 15 301H5H 10 1W 1M 7 18 150.00 125.09 TGT Overview 1 Technical Chart 5 15 30 SH 10 W 30573 50.00 Investing.com 200m 150m 100 m 50.0m Jan 1, 2018 Jan 1, 2020 Jan. 1.2016 Jan 1, 2012 Jan 1, 2014 Max 1 Year 5 years 6 Months 3 Months 1 Month 1 Day 1 Week DELL mon ME Prev Close Open Volume Average Vol.(3m) 1-Year Change 205.76 206.02 3,370,288 3,796,657 93.67% Day's Range 203.53 206.21 52 wk Range 100.5.207.29 Market Cap 103.05B P/E Ratio 23.80 Shares Outstanding 500,877,129 Revenue 93.560 EPS Didend (Yield) 2.12(1.32) Beta 1 Next Earnings Date May 19, 2021 Walmart 140.16 +0.84 (+0.60%) General Chart News & Analysis Financials Technical Forum Insights from Overview Profile Historical Data Options Index Component MT Overview Technical Chart 5 15 30 1H 5H 1D 1W 1M 150.00 140.16 130.00 WMT Overview 1530th 10W m Investing.com 400m 300m 1000 Jan 1, 2012 Jan 1, 2014 Jan 1, 2016 Jan. 1. 2018 Jan 1, 2020 1 Day 1 Week Max 1 Month 3 Months 1 Year 5 years 6 Months 140.16 139.4 Prev. Close Day's Range 52 Rance 139.2.140.47 117.04.153.66 559.15B AZA Revenue EPS Onan 300 100 m Jan 1, 2018 Jan 1, 2012 Jan 1, 2016 Jan. 1.2020 Jan 1, 2014 1 Year 5 years 6 Months Max 1 Day 1 Week 3 Months 1 Month Prev Close Open Volume Average vol (3) 1-Year Change 140.16 139.4 7,236,777 9,444,045 8.85% Day's Range 139.2 - 140.47 52 wk Range 117.04.153.66 Market Cap 394.84B P/E Ratio 29.59 Shares Outstanding 2,817,071,695 Revenue 559.15B EPS 4.74 Dividend (Yield) 2.20 (1.50 Beta 0.45 Next Earnings Date May 18, 2021