

Chinese consumers made 119.25 million visits per year.
Chinese customers made 2.77 million visits per store every year.
Please calculate Walmart's US customer visits per year (Hint - See lecture video)
- US customers made 5722.5 million visits per year
- US customers made 138 million visits per year
- There is insufficient data in the case.
- US customers made 7130 million visits per year
Please calculate Walmart's US customer visits per year per store.
- US customers made 138 million visits per store every year
- US customers made 1.58 million visits per store every year
- There is insufficient data in the case
- US customers made 1.08 million visits per store every year
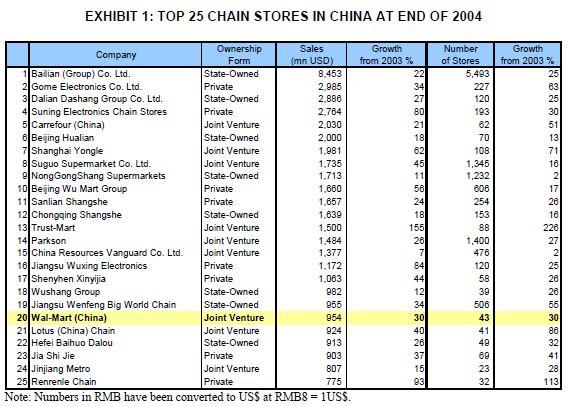
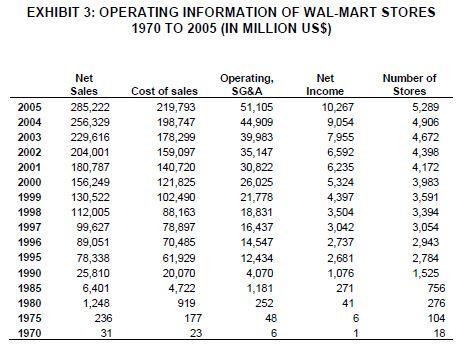
And five years later, Wal-Mart stores could be found in all 50 American states, and in Mexico and Canada. In 2002 it became the world's largest company in terms of sales. On January 31s 2005, Wal-Mart Stores reported net sales of US$285 billion, had a presence in nine countries with 5,289 stores and 1.6 million employees worldwide, offered multiple store formats Customers did feel the difference and came back again and again. Every year over 80% of US households shopped at Wal-Mart, which served 138 million customers a week worldwide. " EXHIBIT 1: TOP 25 CHAIN STORES IN CHINA AT END OF 2004 Number of Stores 5,493 227 120 193 62 70 108 1.345 1.232 808 Company Ownership Sales Form {mn USD) 1 Bailian (Group) Co. Ltd. State-Owned 8.453 2 Gome Electronics Co. Ltd. Private 2.085 3 Dalian Dashang Group Co. Ltd. State-Owned 2.888 4 Suning Electronics Chain Stores Private 2.764 5 Carrefour (China) Joint Venture 2.030 6 Being Hualian State-Owned 2.000 7 Shanghai Yongle Joint Venture 1.981 8 Suguo Supermarket Co. Ltd. Joint Venture 1.735 NongGongShang Supermarkets State-Owned 1.713 10 Bejing Wu Mart Group Private 1.660 11 Sanlian Shangshe Private 1.657 12 Chongqing Shangshe State-Owned 1.639 13 Trust-Mart Joint Venture 1.500 14|Park527 Joint Venture 1.484 15 China Resources Vanguard Co. Ltd. Joint Venture 1,377 16 Jiangsu Wuxing Electronics Private 1.172 17 Shenyhen Xinyijia Private 1.063 18 Wushang Group State-Owned 982 10 Jiangsu Wenfeng Big World Chain State-Owned 955 20 Wal-Mart (China) Joint Venture 954 21 Lotus (China) Chain Joint Venture 924 22 Hefei Baihuo Dalou State-Owned 913 23 Jia Shi Jie Private 203 24 Jinjiang Metro Joint Venture 807 25 Renrenle Chain 775 Note: Numbers in RMB have been converted to USS at RMB8 = 1USS. Growth from 2003 % 22 34 27 80 21 18 62 45 11 56 24 18 155 26 7 84 44 12 34 30 40 26 37 15 93 254 153 88 1,400 476 120 58 39 506 43 41 49 69 23 32 Growth from 2003% 25 63 25 30 51 13 71 16 2 17 26 16 226 27 2 25 26 28 55 30 88 32 41 28 113 Private EXHIBIT 3: OPERATING INFORMATION OF WAL-MART STORES 1970 TO 2005 (IN MILLION US$) 2005 2004 2003 2002 2001 2000 1999 1998 1997 1996 1995 1990 1985 1980 1975 1970 Net Sales 285,222 256,329 229,616 204,001 180,787 156,249 130,522 112,005 99,627 89,051 78,338 25,810 6,401 1,248 236 31 Cost of sales 219,793 198,747 178,299 159,097 140,720 121,825 102,490 88,163 78,897 70,485 61,929 20,070 4,722 919 177 23 Operating, SG&A 51,105 44,909 39,983 35,147 30,822 26,025 21,778 18,831 16,437 14,547 12,434 4,070 1,181 252 48 6 Net Income 10,267 9,054 7,955 6,592 6,235 5,324 4,397 3,504 3,042 2,737 2,681 1,076 271 41 6 1 Number of Stores 5,289 4,906 4,672 4,398 4,172 3,983 3,591 3,394 3,054 2,943 2,784 1,525 756 276 104 18 And five years later, Wal-Mart stores could be found in all 50 American states, and in Mexico and Canada. In 2002 it became the world's largest company in terms of sales. On January 31s 2005, Wal-Mart Stores reported net sales of US$285 billion, had a presence in nine countries with 5,289 stores and 1.6 million employees worldwide, offered multiple store formats Customers did feel the difference and came back again and again. Every year over 80% of US households shopped at Wal-Mart, which served 138 million customers a week worldwide. " EXHIBIT 1: TOP 25 CHAIN STORES IN CHINA AT END OF 2004 Number of Stores 5,493 227 120 193 62 70 108 1.345 1.232 808 Company Ownership Sales Form {mn USD) 1 Bailian (Group) Co. Ltd. State-Owned 8.453 2 Gome Electronics Co. Ltd. Private 2.085 3 Dalian Dashang Group Co. Ltd. State-Owned 2.888 4 Suning Electronics Chain Stores Private 2.764 5 Carrefour (China) Joint Venture 2.030 6 Being Hualian State-Owned 2.000 7 Shanghai Yongle Joint Venture 1.981 8 Suguo Supermarket Co. Ltd. Joint Venture 1.735 NongGongShang Supermarkets State-Owned 1.713 10 Bejing Wu Mart Group Private 1.660 11 Sanlian Shangshe Private 1.657 12 Chongqing Shangshe State-Owned 1.639 13 Trust-Mart Joint Venture 1.500 14|Park527 Joint Venture 1.484 15 China Resources Vanguard Co. Ltd. Joint Venture 1,377 16 Jiangsu Wuxing Electronics Private 1.172 17 Shenyhen Xinyijia Private 1.063 18 Wushang Group State-Owned 982 10 Jiangsu Wenfeng Big World Chain State-Owned 955 20 Wal-Mart (China) Joint Venture 954 21 Lotus (China) Chain Joint Venture 924 22 Hefei Baihuo Dalou State-Owned 913 23 Jia Shi Jie Private 203 24 Jinjiang Metro Joint Venture 807 25 Renrenle Chain 775 Note: Numbers in RMB have been converted to USS at RMB8 = 1USS. Growth from 2003 % 22 34 27 80 21 18 62 45 11 56 24 18 155 26 7 84 44 12 34 30 40 26 37 15 93 254 153 88 1,400 476 120 58 39 506 43 41 49 69 23 32 Growth from 2003% 25 63 25 30 51 13 71 16 2 17 26 16 226 27 2 25 26 28 55 30 88 32 41 28 113 Private EXHIBIT 3: OPERATING INFORMATION OF WAL-MART STORES 1970 TO 2005 (IN MILLION US$) 2005 2004 2003 2002 2001 2000 1999 1998 1997 1996 1995 1990 1985 1980 1975 1970 Net Sales 285,222 256,329 229,616 204,001 180,787 156,249 130,522 112,005 99,627 89,051 78,338 25,810 6,401 1,248 236 31 Cost of sales 219,793 198,747 178,299 159,097 140,720 121,825 102,490 88,163 78,897 70,485 61,929 20,070 4,722 919 177 23 Operating, SG&A 51,105 44,909 39,983 35,147 30,822 26,025 21,778 18,831 16,437 14,547 12,434 4,070 1,181 252 48 6 Net Income 10,267 9,054 7,955 6,592 6,235 5,324 4,397 3,504 3,042 2,737 2,681 1,076 271 41 6 1 Number of Stores 5,289 4,906 4,672 4,398 4,172 3,983 3,591 3,394 3,054 2,943 2,784 1,525 756 276 104 18


