Choose a topic any of your choice and proceed it. Follow all the instructions mentioned below.
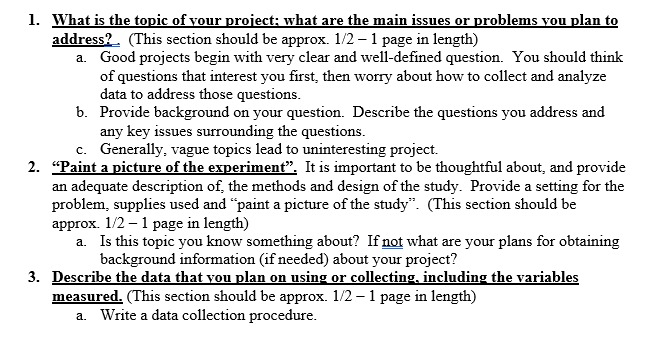
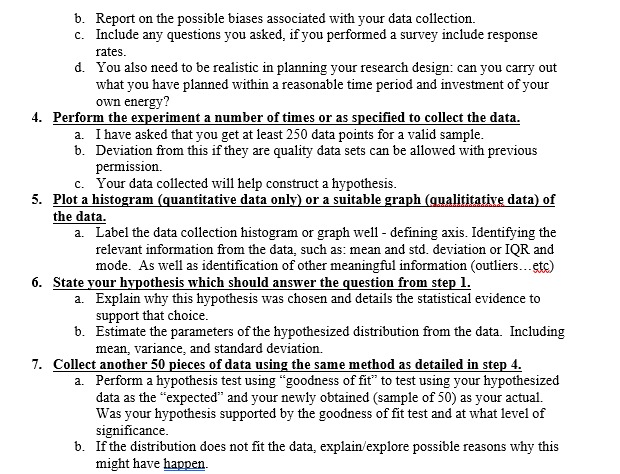
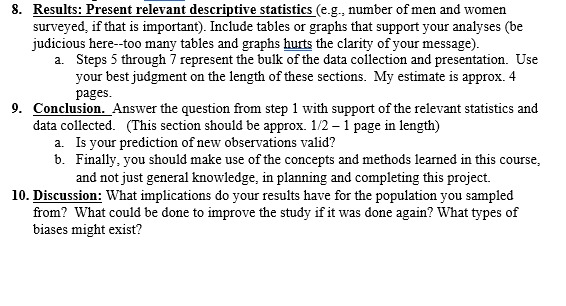
1. What is the topic of your project: what are the main issues or problems you plan to address?. (This section should be approx. 1/2 - 1 page in length) a. Good projects begin with very clear and well-defined question. You should think of questions that interest you first, then worry about how to collect and analyze data to address those questions. b. Provide background on your question. Describe the questions you address and any key issues surrounding the questions. c. Generally, vague topics lead to uninteresting project. 2. "Paint a picture of the experiment". It is important to be thoughtful about, and provide an adequate description of the methods and design of the study. Provide a setting for the problem, supplies used and "paint a picture of the study". (This section should be approx. 1/2 - 1 page in length) a. Is this topic you know something about? If not what are your plans for obtaining background information (if needed) about your project? 3. Describe the data that you plan on using or collecting, including the variables measured. (This section should be approx. 1/2 - 1 page in length) a. Write a data collection procedure.b. Report on the possible biases associated with your data collection. c. Include any questions you asked, if you performed a survey include response rates. d. You also need to be realistic in planning your research design: can you carry out what you have planned within a reasonable time period and investment of your own energy? 4. Perform the experiment a number of times or as specified to collect the data. a. I have asked that you get at least 250 data points for a valid sample. b. Deviation from this if they are quality data sets can be allowed with previous permission. c. Your data collected will help construct a hypothesis. 5. Plot a histogram (quantitative data only) or a suitable graph (qualititative data) of the data. a. Label the data collection histogram or graph well - defining axis. Identifying the relevant information from the data, such as: mean and std. deviation or IQR and mode. As well as identification of other meaningful information (outliers... etc) 6. State your hypothesis which should answer the question from step 1. a. Explain why this hypothesis was chosen and details the statistical evidence to support that choice. b. Estimate the parameters of the hypothesized distribution from the data. Including mean, variance, and standard deviation. 7. Collect another 50 pieces of data using the same method as detailed in step 4. a. Perform a hypothesis test using "goodness of fit" to test using your hypothesized data as the "expected" and your newly obtained (sample of 50) as your actual. Was your hypothesis supported by the goodness of fit test and at what level of significance. b. If the distribution does not fit the data, explain/explore possible reasons why this might have happen.8. Results: Present relevant descriptive statistics (e.g., number of men and women surveyed, if that is important). Include tables or graphs that support your analyses (be judicious here--too many tables and graphs hurts the clarity of your message). a. Steps 5 through 7 represent the bulk of the data collection and presentation. Use your best judgment on the length of these sections. My estimate is approx. 4 pages. 9. Conclusion. Answer the question from step 1 with support of the relevant statistics and data collected. (This section should be approx. 1/2 - 1 page in length) a. Is your prediction of new observations valid? b. Finally, you should make use of the concepts and methods learned in this course, and not just general knowledge, in planning and completing this project. 10. Discussion: What implications do your results have for the population you sampled from? What could be done to improve the study if it was done again? What types of biases might exist


