Choose two years period of Apple Company.
From the balance sheet, income statement, statement of cash flows, and notes to the financial statements, answer the following questions. Answers should be based on accounting ratios and analysis.
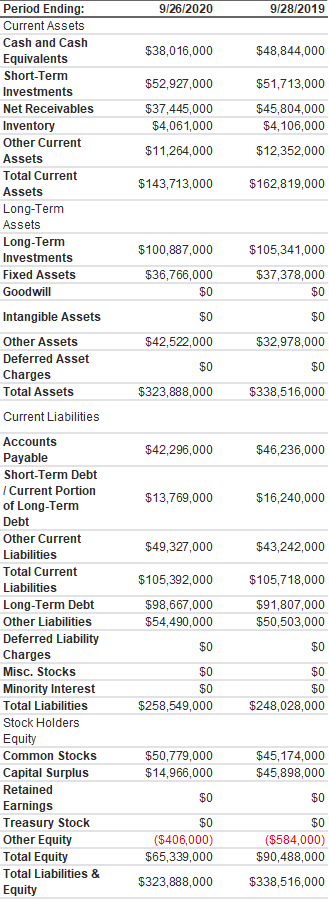
2.1. What are the largest assets included in the company's balance sheet? Why would a company of this type (size and industry) have a large investment in this particular type of asset?
In a review of the company's statement of cash flows:
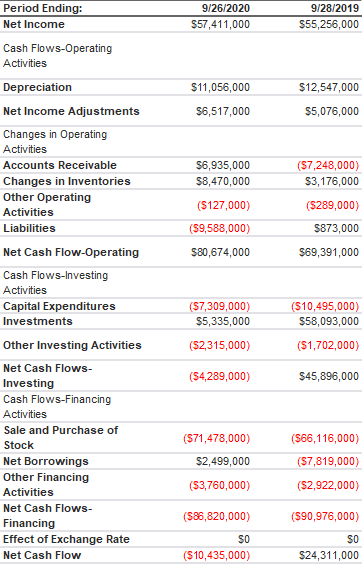
2.2. What are the primary sources and uses of cash from investing activities?
2.3. Did investing activities cause the company's cash to increase or decrease?
2.4. What are the primary sources and uses of cash from financing activities?
2.5. Did financing activities cause the company's cash to increase or decrease?
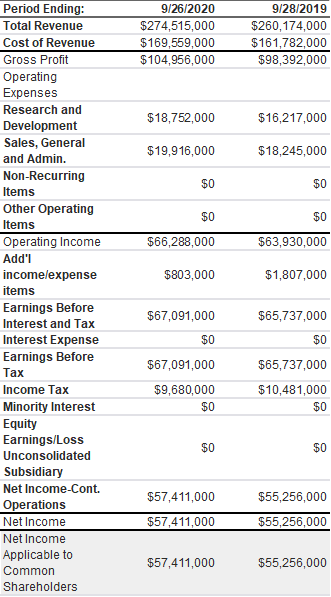
2.6. In a review of the company's income statement, did the company have a net income or a net loss for the most recent year? What percentage of total revenues was that net income or net loss?
2.7. Select three items in the notes accompanying the financial statements and explain briefly the importance of these items to people making decisions about investing in, or extending credit to, this company.
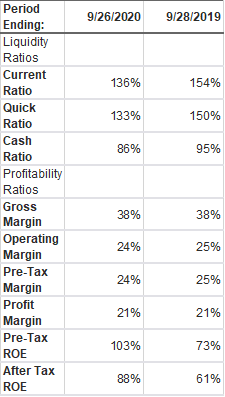
2.8. Assume that you are a lender and this company has asked to borrow an amount of cash equal to 10 percent of its total assets, to be repaid in 90 days. Would you consider this company to be a good credit risk? Explain
9/26/2020 $274,515,000 $169,559,000 $104,956,000 9/28/2019 $260,174,000 $161,782,000 $98,392,000 $18,752,000 $16,217,000 $19,916,000 $18,245,000 $0 $0 $0 $0 $66,288,000 $63,930,000 $803,000 $1,807,000 Period Ending: Total Revenue Cost of Revenue Gross Profit Operating Expenses Research and Development Sales, General and Admin. Non-Recurring Items Other Operating Items Operating Income Add'l income/expense items Earnings Before Interest and Tax Interest Expense Earnings Before Tax Income Tax Minority Interest Equity Earnings/Loss Unconsolidated Subsidiary Net Income-Cont. Operations Net Income Net Income Applicable to Common Shareholders $65,737,000 $0 $67,091,000 $0 $67,091,000 $9,680,000 $0 $65,737,000 $10,481,000 $0 $0 $0 $55,256,000 $57,411,000 $57,411,000 $55,256,000 $57,411,000 $55,256,000 9/26/2020 9/28/2019 $38,016,000 $48,844,000 $52,927,000 $37,445,000 $4,061,000 $11,264,000 $51,713,000 $45,804,000 $4,106,000 $12,352,000 $143,713,000 $162,819,000 $100,887,000 $36,766,000 $0 $105,341,000 $37,378,000 $0 $0 $0 $32,978,000 $42,522,000 $0 $0 $323,888,000 $338,516,000 Period Ending: Current Assets Cash and Cash Equivalents Short-Term Investments Net Receivables Inventory Other Current Assets Total Current Assets Long-Term Assets Long-Term Investments Fixed Assets Goodwill Intangible Assets Other Assets Deferred Asset Charges Total Assets Current Liabilities Accounts Payable Short-Term Debt Current Portion of Long-Term Debt Other Current Liabilities Total Current Liabilities Long-Term Debt Other Liabilities Deferred Liability Charges Misc. Stocks Minority Interest Total Liabilities Stock Holders Equity Common Stocks Capital Surplus Retained Earnings Treasury Stock Other Equity Total Equity Total Liabilities & Equity $42,296,000 $46,236,000 $13,769,000 $16,240,000 $49,327,000 $43,242,000 $105,392,000 $98,667,000 $54,490,000 $105,718,000 $91,807,000 $50,503,000 $0 $0 $0 $0 $258,549,000 $0 $0 $248,028,000 $45,174,000 $45,898,000 $0 $50,779,000 $14,966,000 $0 $0 ($406,000) $65,339,000 $323,888,000 $0 ($584,000) $90,488,000 $338,516,000 9/26/2020 $57,411,000 9/28/2019 $55,256,000 $12,547,000 $11,056,000 $6,517,000 $5,076,000 $6,935,000 $8,470,000 (5127,000) (59,588,000) $80,674,000 (57,248,000) $3,176,000 ($289,000) $873,000 $69,391,000 Period Ending: Net Income Cash Flows-Operating Activities Depreciation Net Income Adjustments Changes in Operating Activities Accounts Receivable Changes in Inventories Other Operating Activities Liabilities Net Cash Flow-Operating Cash Flows-Investing Activities Capital Expenditures Investments Other Investing Activities Net Cash Flows- Investing Cash Flows-Financing Activities Sale and Purchase of Stock Net Borrowings Other Financing Activities Net Cash Flows- Financing Effect of Exchange Rate Net Cash Flow (57,309,000) $5,335,000 ($2,315,000) ($10,495,000) $58,093,000 ($1,702,000) (54,289,000) $45,896,000 ($71,478,000) $2,499,000 ($3,760,000) (566,116,000) (57,819,000) (52,922,000) (590,976,000) (586,820,000) $0 ($10,435,000) SO $24,311,000 9/26/2020 9/28/2019 136% 154% 133% 150% 86% 95% Period Ending: Liquidity Ratios Current Ratio Quick Ratio Cash Ratio Profitability Ratios Gross Margin Operating Margin Pre-Tax Margin Profit Margin Pre-Tax ROE After Tax ROE 38% 38% 24% 25% 24% 25% 21% 21% 103% 73% 88% 61%


