

Question
Chs=0.001; Chd=0.01; dt=0.001; N=800; t=[0:dt:(N-1)*dt]; Ts=0.03; Td=0.06; Chstemp=(Chd-Chs)*exp(-t/Ts)+Chs; Chdtemp=(Chs-Chd)*exp(-t/Td)+Chd; Ch(1:100)=Chdtemp; Ch(101:350)=Chstemp(1:250); Ch(351:800)=Chdtemp; Plot(t,Ch) here is my MATLAB Code it is not working please help 1.
Chs=0.001;
Chd=0.01;
dt=0.001;
N=800;
t=[0:dt:(N-1)*dt];
Ts=0.03;
Td=0.06;
Chstemp=(Chd-Chs)*exp(-t/Ts)+Chs;
Chdtemp=(Chs-Chd)*exp(-t/Td)+Chd;
Ch(1:100)=Chdtemp;
Ch(101:350)=Chstemp(1:250);
Ch(351:800)=Chdtemp;
Plot(t,Ch)
here is my MATLAB Code it is not working please help
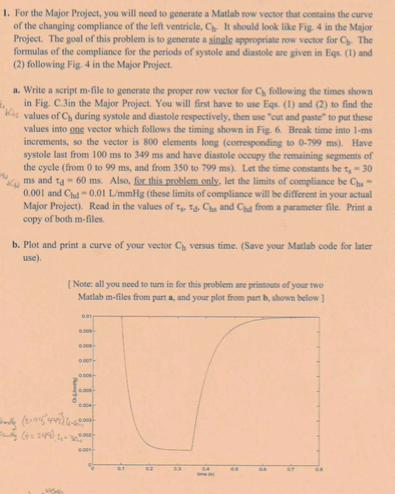
1. For the Major Project, you will need to generate a Matlab row vector that contains the curve of the changing compliance of the left ventricle, Ch It should look like Fig. 4 in the Major Project. The goal of this problem is to generate a singls appropriate row vector for Ch The formulas of the compliance for the periods of systole and diastole are given in Eqs. (1) and (2) following Fig. 4 in the Major Project a. Write a script m-file to generate the proper row vector for C following the times showr in Fig. C.3in the Major Project. You will first have to use Eqs (1) and (2) to find the g values of Ch during systole and diastole respectively, then use "cut and paste" to put these values into one vector which follows the timing shown in Fig. 6. Break time into 1-ms increments, so the vector is 800 elements long (corresponding to 0-799 ms). Have systole last from 100 ms to 349 ms and have diastole occupy the remaining segments of the cycle (from 0 to 99 ms, and from 350 to 799 ms). Let the time constants be t-30 ms and td 60 ms. Aso, for this problem only, let the limits of compliance be Chs Major Project). Read in the values of t. T Chs and Chd from a parameter file. Print 0.001 and Chd 0.01 L/mmHg (hese limits of compliance will be different in your actual copy of both m-files b. Plot and print a curve of your vector Ch versus time. (Save your Matlab code for later [Note: all you need to turn in for this problem are printouts of your two Matlab m-files from part a, and your plot from part b, shown belowStep by Step Solution
There are 3 Steps involved in it
Step: 1

Get Instant Access to Expert-Tailored Solutions
See step-by-step solutions with expert insights and AI powered tools for academic success
Step: 2

Step: 3
Ace Your Homework with AI
Get the answers you need in no time with our AI-driven, step-by-step assistance
Get Started
Transact SQL Cookbook Help For Database Programmers
Authors: Ales Spetic, Jonathan Gennick
1st Edition
1565927567, 978-1565927568