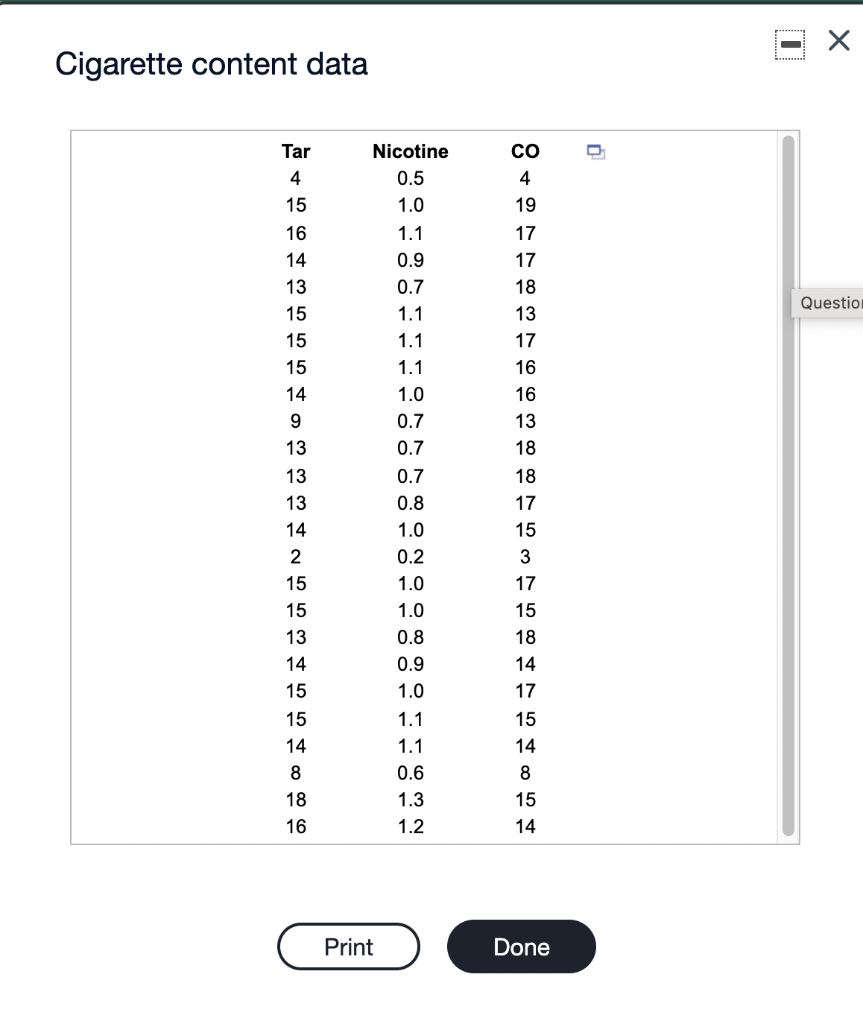
Cigarette content data X Tar Nicotine CO 4 0.5 4 15 1.0 19 16 1.1 17 14 0.9 17 13 0.7 18 15 1.1 13
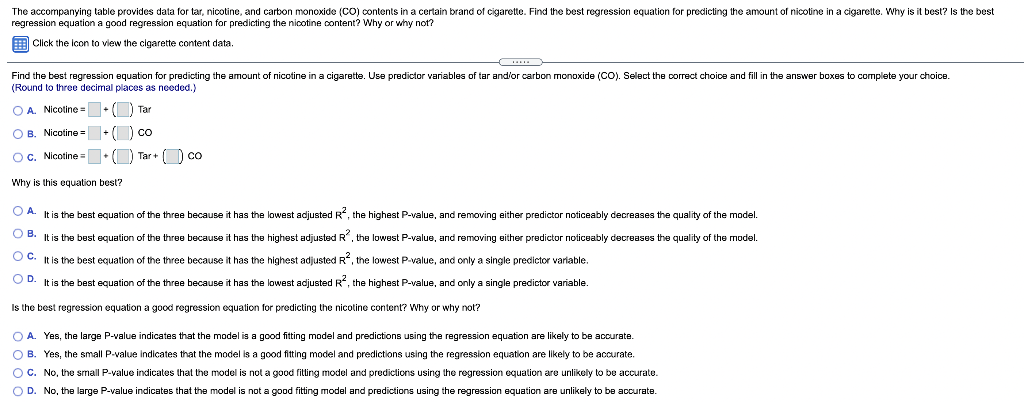
Cigarette content data X Tar Nicotine CO 4 0.5 4 15 1.0 19 16 1.1 17 14 0.9 17 13 0.7 18 15 1.1 13 Questio 15 1.1 17 15 1.1 16 14 1.0 16 9 0.7 13 13 0.7 18 13 0.7 18 13 0.8 17 14 1.0 15 2 0.2 3 15 1.0 17 15 1.0 15 13 0.8 18 14 0.9 14 15 1.0 17 15 1.1 15 14 1.1 14 8 0.6 8 18 1.3 15 16 1.2 14 Print DoneThe accompanying table provides data for tar, nicotine, and carbon monoxide (CO) contents in a certain brand of cigarette. Find the best regression equation for predicting the amount of nicotine in a cigarette. Why is it best? Is the best regression equation a good regression equation for predicting the nicotine content? Why or why not? Click the Icon to view the cigarette content data. Find the best regression equation for predicting the amount of nicotine in a cigarette. Use predictor variables of tar and/or carbon monoxide (CO). Select the correct choice and fill in the answer boxes to complete your choice. (Round to three decimal places as needed.) O A. Nicotine = + ( ) Tar O B. Nicotine = + ( ) co O c. Nicotine = |+ () Tar + ( [) co Why is this equation best? A. It is the best equation of the three because it has the lowest adjusted R , the highest P-value, and removing either predictor noticeably decreases the quality of the model. JE. It is the best equation of the three because it has the highest adjusted R , the lowest P-value, and removing either predictor noticeably decreases the quality of the model. " It is the best equation of the three because it has the highest adjusted R", the lowest P-value, and only a single predictor variable. D. It is the best equation of the three because it has the lowest adjusted R" , the highest P-value, and only a single predictor variable. Is the best regression equation a good regression equation for predicting the nicotine content? Why or why not? O A. Yes, the large P-value indicates that the model is a good fitting model and predictions using the regression equation are likely to be accurate. O B. Yes, the small P-value indicates that the model is a good fitting model and predictions using the regression equation are likely to be accurate. O C. No, the small P-value indicates that the model is not a good filling model and predictions using the regression equation are unlikely to be accurate. O D. No, the large P-value indicates that the model is not a good fitting model and predictions using the regression equation are unlikely to be accurate
Step by Step Solution
There are 3 Steps involved in it
Step: 1
Get Instant Access to Expert-Tailored Solutions
See step-by-step solutions with expert insights and AI powered tools for academic success
Step: 2
Step: 3
Ace Your Homework with AI
Get the answers you need in no time with our AI-driven, step-by-step assistance