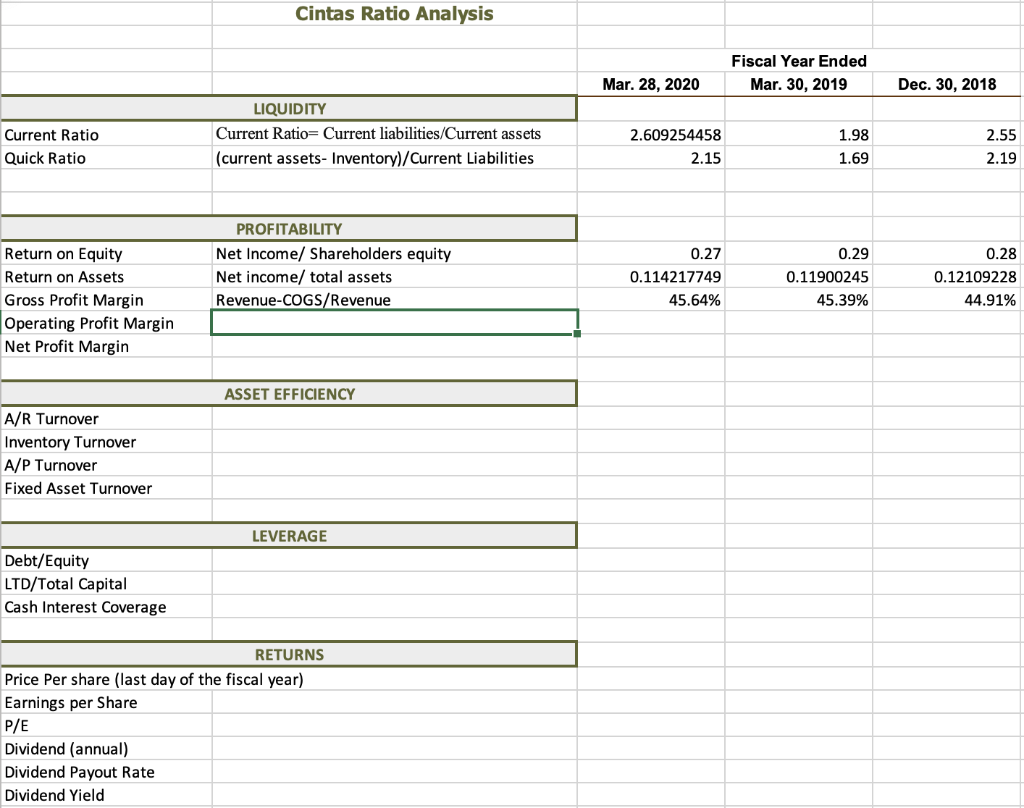
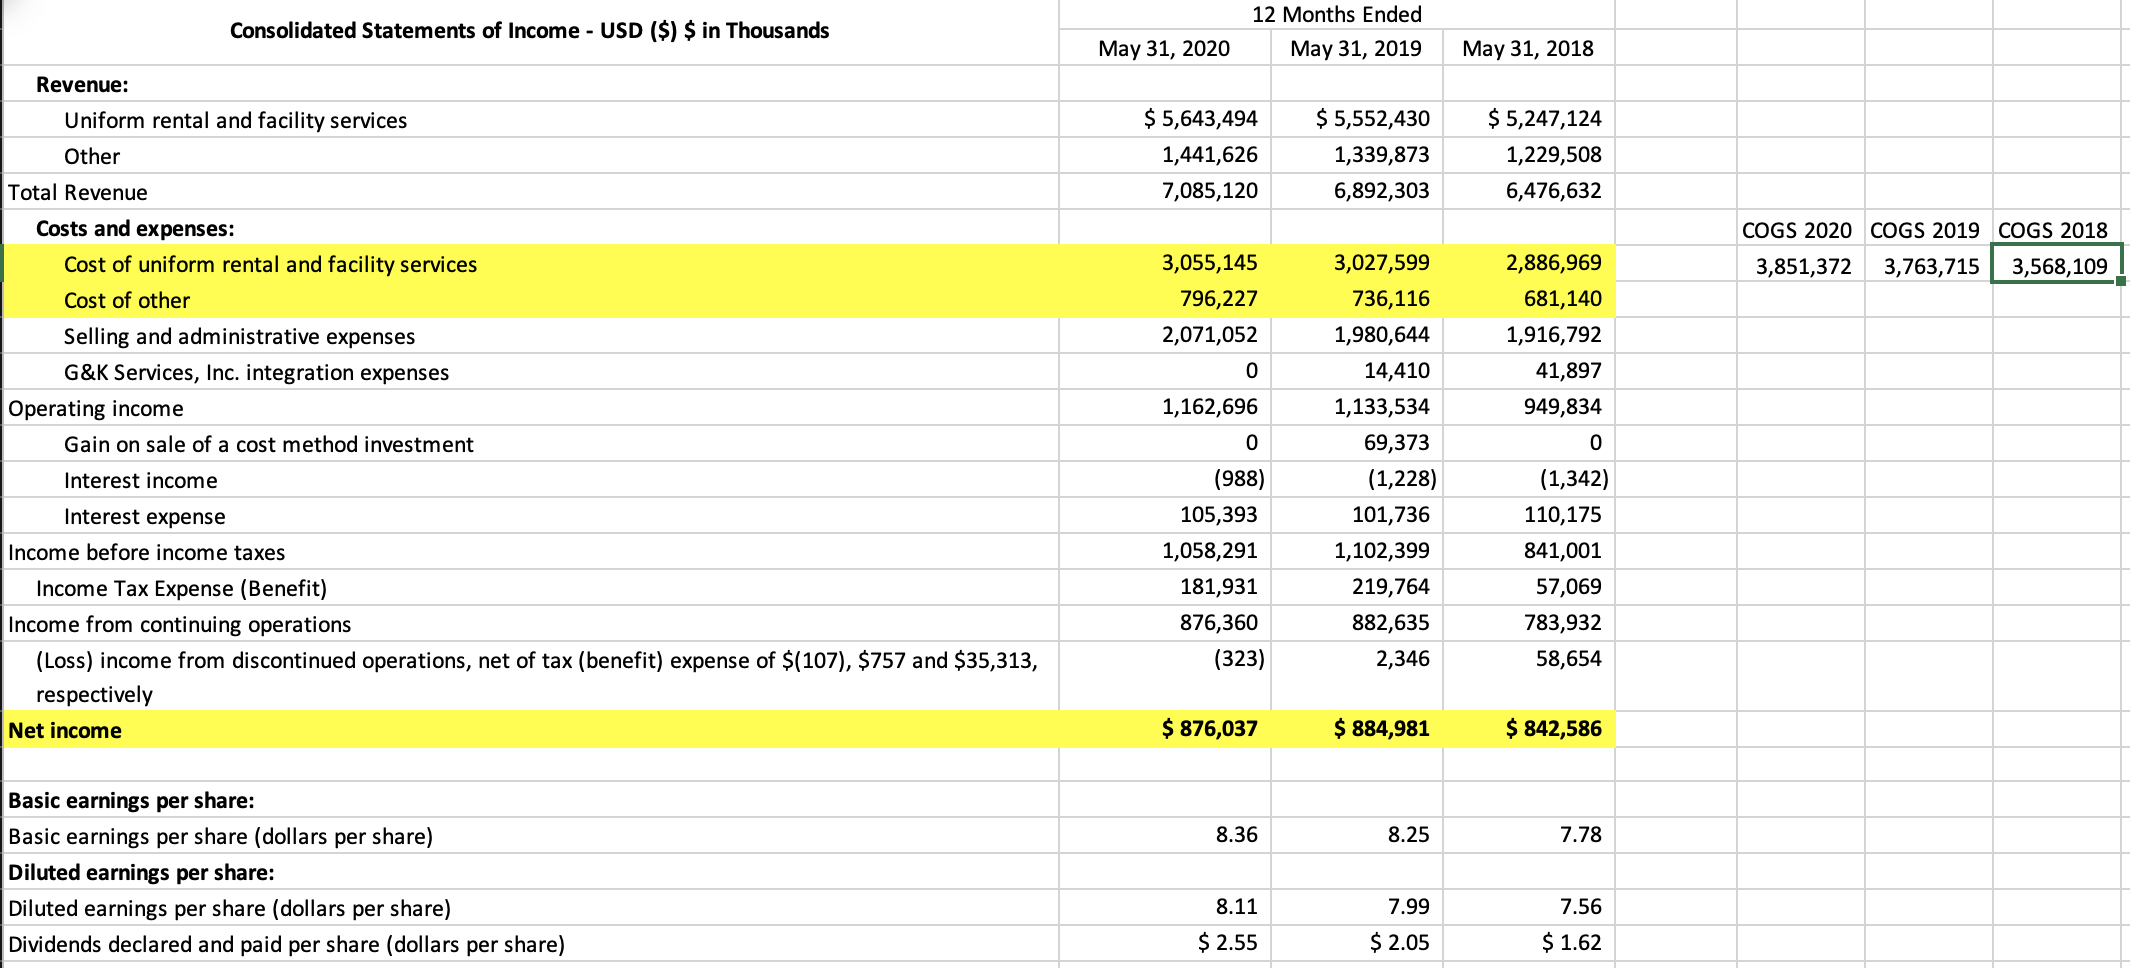
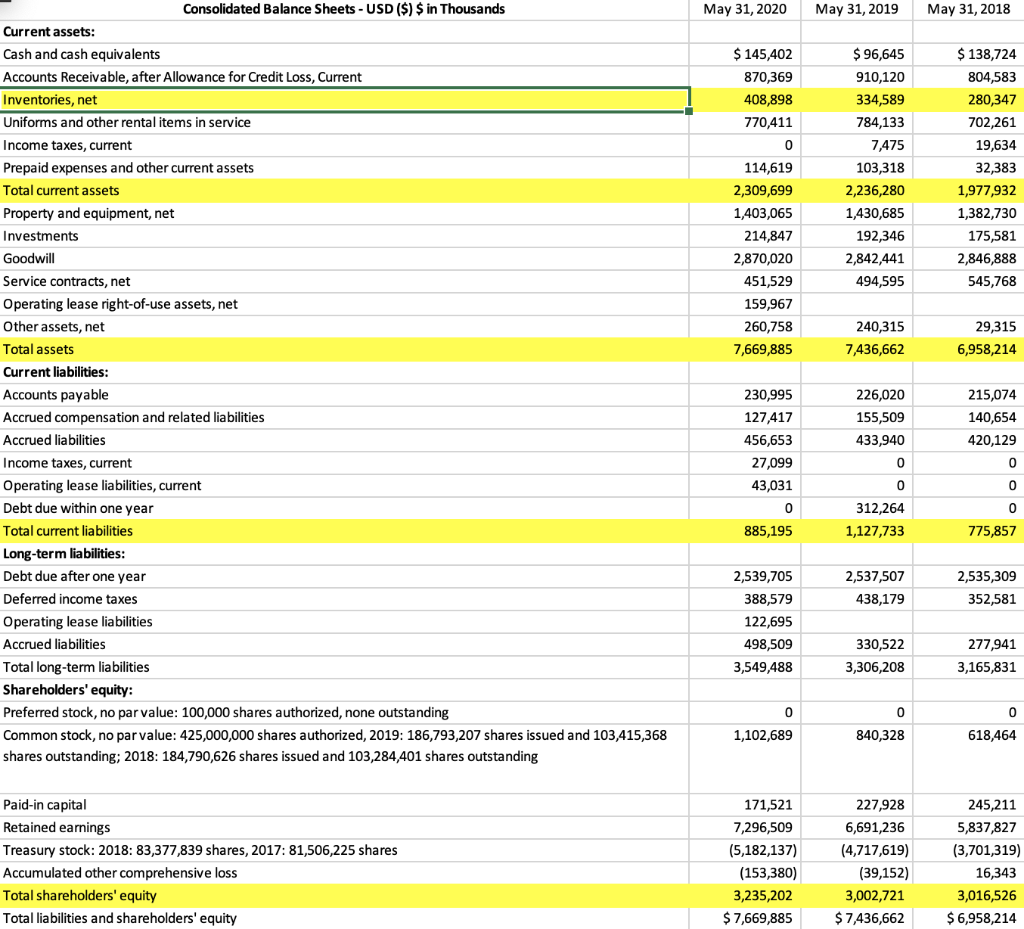
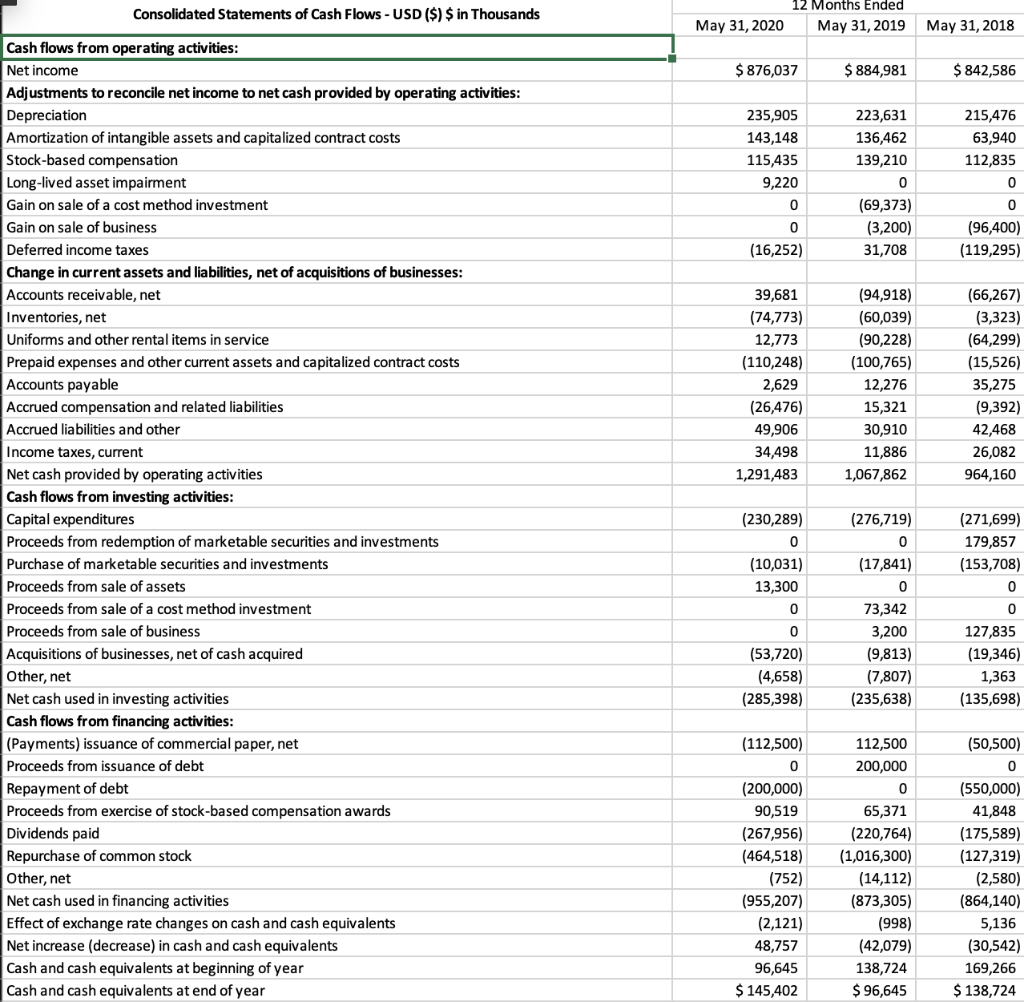
Cintas Ratio Analysis Fiscal Year Ended Mar. 30, 2019 Mar. 28, 2020 Dec. 30, 2018 Current Ratio Quick Ratio LIQUIDITY Current Ratio= Current liabilities/Current assets (current assets- Inventory)/Current Liabilities 2.609254458 2.15 1.98 1.69 2.55 2.19 0.27 0.29 Return on Equity Return on Assets Gross Profit Margin Operating Profit Margin Net Profit Margin PROFITABILITY Net Income/ Shareholders equity Net income/ total assets Revenue-COGS/Revenue 0.114217749 45.64% 0.11900245 45.39% 0.28 0.12109228 44.91% ASSET EFFICIENCY A/R Turnover Inventory Turnover A/P Turnover Fixed Asset Turnover LEVERAGE Debt/Equity LTD/Total Capital Cash Interest Coverage RETURNS Price Per share (last day of the fiscal year) Earnings per Share P/E Dividend (annual) Dividend Payout Rate Dividend Yield Consolidated Statements of Income - USD ($) $ in Thousands 12 Months Ended May 31, 2019 May 31, 2020 May 31, 2018 Revenue: $ 5,643,494 1,441,626 7,085,120 $ 5,552,430 1,339,873 6,892,303 $ 5,247,124 1,229,508 6,476,632 COGS 2020 COGS 2019 COGS 2018 3,851,372 3,763,715 3,568,109 3,055,145 796,227 2,071,052 0 1,162,696 Uniform rental and facility services Other Total Revenue Costs and expenses: Cost of uniform rental and facility services Cost of other Selling and administrative expenses G&K Services, Inc. integration expenses Operating income Gain on sale of a cost method investment Interest income Interest expense Income before income taxes Income Tax Expense (Benefit) Income from continuing operations (Loss) income from discontinued operations, net of tax (benefit) expense of $(107), $757 and $35,313, respectively Net income 0 3,027,599 736,116 1,980,644 14,410 1,133,534 69,373 (1,228) 101,736 1,102,399 219,764 882,635 2,346 2,886,969 681,140 1,916,792 41,897 949,834 0 (1,342) 110,175 841,001 57,069 783,932 58,654 (988) 105,393 1,058,291 181,931 876,360 (323) $ 876,037 $ 884,981 $ 842,586 8.36 8.25 7.78 Basic earnings per share: Basic earnings per share (dollars per share) Diluted earnings per share: Diluted earnings per share (dollars per share) Dividends declared and paid per share (dollars per share) 8.11 7.99 7.56 $ 2.55 $ 2.05 $ 1.62 May 31, 2020 May 31, 2019 May 31, 2018 $ 145,402 870,369 408,898 770,411 o 114,619 2,309,699 1,403,065 214,847 2,870,020 451,529 159,967 260,758 7,669,885 $ 96,645 910,120 334,589 784,133 7,475 103,318 2,236,280 1,430,685 192,346 2,842,441 494,595 $ 138,724 804,583 280,347 702,261 19,634 32,383 1,977,932 1,382,730 175,581 2,846,888 545,768 240,315 7,436,662 29,315 6,958,214 Consolidated Balance Sheets - USD ($) $ in Thousands Current assets: Cash and cash equivalents Accounts Receivable, after Allowance for Credit Loss, Current Inventories, net Uniforms and other rental items in service Income taxes, current Prepaid expenses and other current assets Total current assets Property and equipment, net Investments Goodwill Service contracts, net Operating lease right-of-use assets, net Other assets, net Total assets Current liabilities: Accounts payable Accrued compensation and related liabilities Accrued liabilities Income taxes, current Operating lease liabilities, current Debt due within one year Total current liabilities Long-term liabilities: Debt due after one year Deferred income taxes Operating lease liabilities Accrued liabilities Total long-term liabilities Shareholders' equity: Preferred stock, no par value: 100,000 shares authorized, none outstanding Common stock, no par value: 425,000,000 shares authorized, 2019: 186,793,207 shares issued and 103,415,368 shares outstanding; 2018: 184,790,626 shares issued and 103,284,401 shares outstanding 230,995 127,417 456,653 27,099 43,031 226,020 155,509 433,940 0 0 312,264 1,127,733 215,074 140,654 420,129 0 0 0 775,857 885,195 2,537,507 438,179 2,535,309 352,581 2,539,705 388,579 122,695 498,509 3,549,488 330,522 3,306,208 277,941 3,165,831 0 0 0 1,102,689 840,328 618,464 Paid-in capital Retained earnings Treasury stock: 2018: 83,377,839 shares, 2017: 81,506,225 shares Accumulated other comprehensive loss Total shareholders' equity Total liabilities and shareholders' equity 171,521 7,296,509 (5,182,137) (153,380) 3,235,202 $7,669,885 227,928 6,691,236 (4,717,619) (39,152) 3,002,721 $ 7,436,662 245,211 5,837,827 (3,701,319) 16,343 3,016,526 $ 6,958,214 Consolidated Statements of Cash Flows - USD ($) $ in Thousands May 31, 2020 12 Months Ended May 31, 2019 May 31, 2018 $ 876,037 $ 884,981 $ 842,586 235,905 143,148 115,435 9,220 215,476 63,940 112,835 223,631 136,462 139,210 0 (69,373) (3,200) 31,708 0 0 0 0 (96,400) (119,295) (16,252) 39,681 (74,773) 12,773 (110,248) 2,629 (26,476) 49,906 34,498 1,291,483 (94,918) (60,039) (90,228) (100,765) 12,276 15,321 30,910 11,886 1,067,862 (66,267) (3,323) (64,299) (15,526) 35,275 (9,392) 42,468 26,082 964,160 Cash flows from operating activities: Net income Adjustments to reconcile net income to net cash provided by operating activities: Depreciation Amortization of intangible assets and capitalized contract costs Stock-based compensation Long-lived asset impairment Gain on sale of a cost method investment Gain on sale of business Deferred income taxes Change in current assets and liabilities, net of acquisitions of businesses: Accounts receivable, net Inventories, net Uniforms and other rental items in service Prepaid expenses and other current assets and capitalized contract costs Accounts payable Accrued compensation and related liabilities Accrued liabilities and other Income taxes, current Net cash provided by operating activities Cash flows from investing activities: Capital expenditures Proceeds from redemption of marketable securities and investments Purchase of marketable securities and investments Proceeds from sale of assets Proceeds from sale of a cost method investment Proceeds from sale of business Acquisitions of businesses, net of cash acquired Other, net Net cash used in investing activities Cash flows from financing activities: (Payments) issuance of commercial paper, net Proceeds from issuance of debt Repayment of debt Proceeds from exercise of stock-based compensation awards Dividends paid Repurchase of common stock Other, net Net cash used in financing activities Effect of exchange rate changes on cash and cash equivalents Net increase (decrease) in cash and cash equivalents Cash and cash equivalents at beginning of year Cash and cash equivalents at end of year (230,289) 0 (10,031) 13,300 0 (271,699) 179,857 (153,708) 0 (276,719) 0 (17,841) 0 73,342 3,200 (9,813) (7,807) (235,638) 0 0 (53,720) (4,658) (285,398) 127,835 (19,346) 1,363 (135,698) 112,500 200,000 0 65,371 (112,500) 0 (200,000) 90,519 (267,956) (464,518) (752) (955,207) (2,121) 48,757 96,645 $ 145,402 (220,764) (1,016,300) (14,112) (873,305) (998) (42,079) 138,724 $ 96,645 (50,500) 0 (550,000) 41,848 (175,589) (127,319) (2,580) (864,140) 5,136 (30,542) 169,266 $ 138,724 Cintas Ratio Analysis Fiscal Year Ended Mar. 30, 2019 Mar. 28, 2020 Dec. 30, 2018 Current Ratio Quick Ratio LIQUIDITY Current Ratio= Current liabilities/Current assets (current assets- Inventory)/Current Liabilities 2.609254458 2.15 1.98 1.69 2.55 2.19 0.27 0.29 Return on Equity Return on Assets Gross Profit Margin Operating Profit Margin Net Profit Margin PROFITABILITY Net Income/ Shareholders equity Net income/ total assets Revenue-COGS/Revenue 0.114217749 45.64% 0.11900245 45.39% 0.28 0.12109228 44.91% ASSET EFFICIENCY A/R Turnover Inventory Turnover A/P Turnover Fixed Asset Turnover LEVERAGE Debt/Equity LTD/Total Capital Cash Interest Coverage RETURNS Price Per share (last day of the fiscal year) Earnings per Share P/E Dividend (annual) Dividend Payout Rate Dividend Yield Consolidated Statements of Income - USD ($) $ in Thousands 12 Months Ended May 31, 2019 May 31, 2020 May 31, 2018 Revenue: $ 5,643,494 1,441,626 7,085,120 $ 5,552,430 1,339,873 6,892,303 $ 5,247,124 1,229,508 6,476,632 COGS 2020 COGS 2019 COGS 2018 3,851,372 3,763,715 3,568,109 3,055,145 796,227 2,071,052 0 1,162,696 Uniform rental and facility services Other Total Revenue Costs and expenses: Cost of uniform rental and facility services Cost of other Selling and administrative expenses G&K Services, Inc. integration expenses Operating income Gain on sale of a cost method investment Interest income Interest expense Income before income taxes Income Tax Expense (Benefit) Income from continuing operations (Loss) income from discontinued operations, net of tax (benefit) expense of $(107), $757 and $35,313, respectively Net income 0 3,027,599 736,116 1,980,644 14,410 1,133,534 69,373 (1,228) 101,736 1,102,399 219,764 882,635 2,346 2,886,969 681,140 1,916,792 41,897 949,834 0 (1,342) 110,175 841,001 57,069 783,932 58,654 (988) 105,393 1,058,291 181,931 876,360 (323) $ 876,037 $ 884,981 $ 842,586 8.36 8.25 7.78 Basic earnings per share: Basic earnings per share (dollars per share) Diluted earnings per share: Diluted earnings per share (dollars per share) Dividends declared and paid per share (dollars per share) 8.11 7.99 7.56 $ 2.55 $ 2.05 $ 1.62 May 31, 2020 May 31, 2019 May 31, 2018 $ 145,402 870,369 408,898 770,411 o 114,619 2,309,699 1,403,065 214,847 2,870,020 451,529 159,967 260,758 7,669,885 $ 96,645 910,120 334,589 784,133 7,475 103,318 2,236,280 1,430,685 192,346 2,842,441 494,595 $ 138,724 804,583 280,347 702,261 19,634 32,383 1,977,932 1,382,730 175,581 2,846,888 545,768 240,315 7,436,662 29,315 6,958,214 Consolidated Balance Sheets - USD ($) $ in Thousands Current assets: Cash and cash equivalents Accounts Receivable, after Allowance for Credit Loss, Current Inventories, net Uniforms and other rental items in service Income taxes, current Prepaid expenses and other current assets Total current assets Property and equipment, net Investments Goodwill Service contracts, net Operating lease right-of-use assets, net Other assets, net Total assets Current liabilities: Accounts payable Accrued compensation and related liabilities Accrued liabilities Income taxes, current Operating lease liabilities, current Debt due within one year Total current liabilities Long-term liabilities: Debt due after one year Deferred income taxes Operating lease liabilities Accrued liabilities Total long-term liabilities Shareholders' equity: Preferred stock, no par value: 100,000 shares authorized, none outstanding Common stock, no par value: 425,000,000 shares authorized, 2019: 186,793,207 shares issued and 103,415,368 shares outstanding; 2018: 184,790,626 shares issued and 103,284,401 shares outstanding 230,995 127,417 456,653 27,099 43,031 226,020 155,509 433,940 0 0 312,264 1,127,733 215,074 140,654 420,129 0 0 0 775,857 885,195 2,537,507 438,179 2,535,309 352,581 2,539,705 388,579 122,695 498,509 3,549,488 330,522 3,306,208 277,941 3,165,831 0 0 0 1,102,689 840,328 618,464 Paid-in capital Retained earnings Treasury stock: 2018: 83,377,839 shares, 2017: 81,506,225 shares Accumulated other comprehensive loss Total shareholders' equity Total liabilities and shareholders' equity 171,521 7,296,509 (5,182,137) (153,380) 3,235,202 $7,669,885 227,928 6,691,236 (4,717,619) (39,152) 3,002,721 $ 7,436,662 245,211 5,837,827 (3,701,319) 16,343 3,016,526 $ 6,958,214 Consolidated Statements of Cash Flows - USD ($) $ in Thousands May 31, 2020 12 Months Ended May 31, 2019 May 31, 2018 $ 876,037 $ 884,981 $ 842,586 235,905 143,148 115,435 9,220 215,476 63,940 112,835 223,631 136,462 139,210 0 (69,373) (3,200) 31,708 0 0 0 0 (96,400) (119,295) (16,252) 39,681 (74,773) 12,773 (110,248) 2,629 (26,476) 49,906 34,498 1,291,483 (94,918) (60,039) (90,228) (100,765) 12,276 15,321 30,910 11,886 1,067,862 (66,267) (3,323) (64,299) (15,526) 35,275 (9,392) 42,468 26,082 964,160 Cash flows from operating activities: Net income Adjustments to reconcile net income to net cash provided by operating activities: Depreciation Amortization of intangible assets and capitalized contract costs Stock-based compensation Long-lived asset impairment Gain on sale of a cost method investment Gain on sale of business Deferred income taxes Change in current assets and liabilities, net of acquisitions of businesses: Accounts receivable, net Inventories, net Uniforms and other rental items in service Prepaid expenses and other current assets and capitalized contract costs Accounts payable Accrued compensation and related liabilities Accrued liabilities and other Income taxes, current Net cash provided by operating activities Cash flows from investing activities: Capital expenditures Proceeds from redemption of marketable securities and investments Purchase of marketable securities and investments Proceeds from sale of assets Proceeds from sale of a cost method investment Proceeds from sale of business Acquisitions of businesses, net of cash acquired Other, net Net cash used in investing activities Cash flows from financing activities: (Payments) issuance of commercial paper, net Proceeds from issuance of debt Repayment of debt Proceeds from exercise of stock-based compensation awards Dividends paid Repurchase of common stock Other, net Net cash used in financing activities Effect of exchange rate changes on cash and cash equivalents Net increase (decrease) in cash and cash equivalents Cash and cash equivalents at beginning of year Cash and cash equivalents at end of year (230,289) 0 (10,031) 13,300 0 (271,699) 179,857 (153,708) 0 (276,719) 0 (17,841) 0 73,342 3,200 (9,813) (7,807) (235,638) 0 0 (53,720) (4,658) (285,398) 127,835 (19,346) 1,363 (135,698) 112,500 200,000 0 65,371 (112,500) 0 (200,000) 90,519 (267,956) (464,518) (752) (955,207) (2,121) 48,757 96,645 $ 145,402 (220,764) (1,016,300) (14,112) (873,305) (998) (42,079) 138,724 $ 96,645 (50,500) 0 (550,000) 41,848 (175,589) (127,319) (2,580) (864,140) 5,136 (30,542) 169,266 $ 138,724


