

Question
Circumference 85mm 88mm 86mm 87mm 86mm 82mm 86mm 96mm 87mm 8mm 8mm 8mm 85mm 82mm 83mm 90mm 85mm 90mm Volume (change to cm^3 10.35 cm3
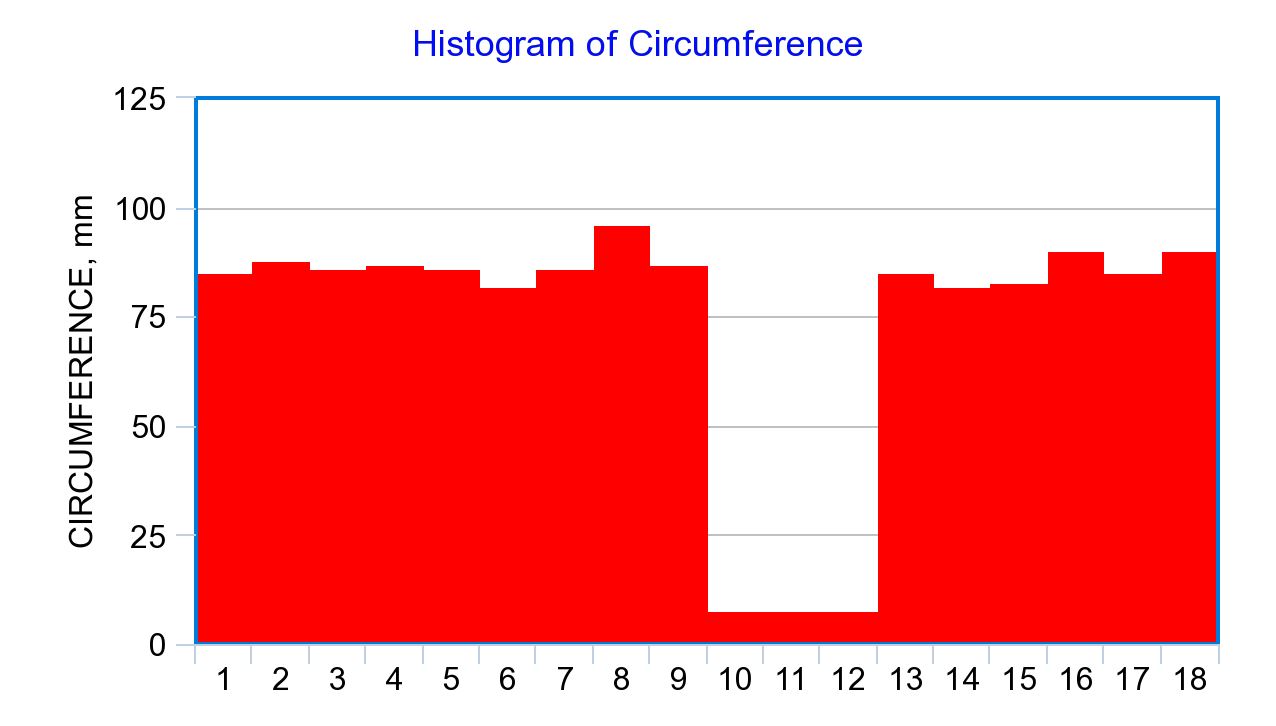
Circumference
- 85mm
- 88mm
- 86mm
- 87mm
- 86mm
- 82mm
- 86mm
- 96mm
- 87mm
- 8mm
- 8mm
- 8mm
- 85mm
- 82mm
- 83mm
- 90mm
- 85mm
- 90mm
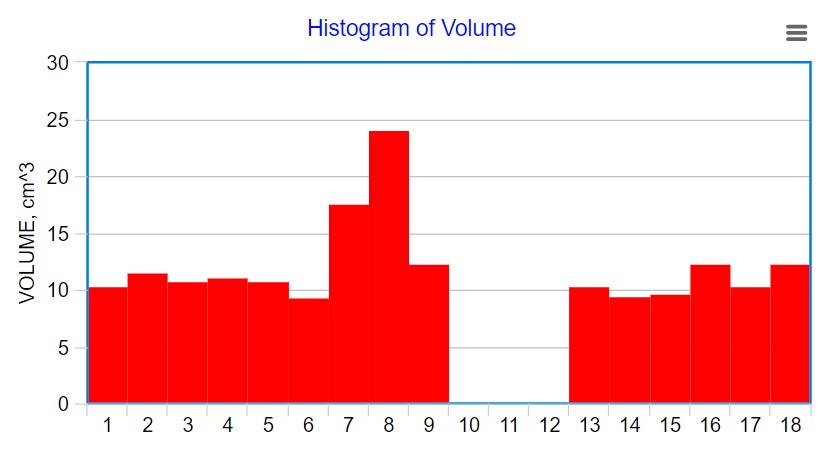
Volume (change to cm^3
10.35 cm3
11.49 cm3
10.73 cm3
11.12 cm3
10.74 cm3
9.31 cm3
17.55 cm3
24.05cm3
12.32cm3
0.0075 cm3
0.01725 cm3
0.01155 cm
10.3cm
9.41cm
9.63cm
12.3cm^3
10.37cm^3
12.3cm^3
1.Compare your histogram against the description normal distribution. Do your data values seem to be normally distributed do they fit a bell shaped curve if not or your histograms bio modal or skewed? Explain.
2.The mean median and mode or three different statistics that describe the typical individual in the population. On the basis of your daughter doesn't matter very much which of these statistics are use?
3. Compare the numbers that you got for the mean, median , mode , range , variance , and standard deviation for the entire group of tomatoes measured by the class . For each statistic , there a large difference between these numbers ? Why is it important to have a large sample size (e.g., large number of tomatoes instead of only two or three tomatoes ) when you are sampling a population ?
4.We noted the variation within the tomato fruits in the population. ( They are not all the same size and we were not expecting them to all be identical in size and shape.) Give an explanation for the existence of such variation .
Step by Step Solution
There are 3 Steps involved in it
Step: 1

Get Instant Access to Expert-Tailored Solutions
See step-by-step solutions with expert insights and AI powered tools for academic success
Step: 2

Step: 3
Ace Your Homework with AI
Get the answers you need in no time with our AI-driven, step-by-step assistance
Get Started