

Answered step by step
Verified Expert Solution
Question
1 Approved Answer
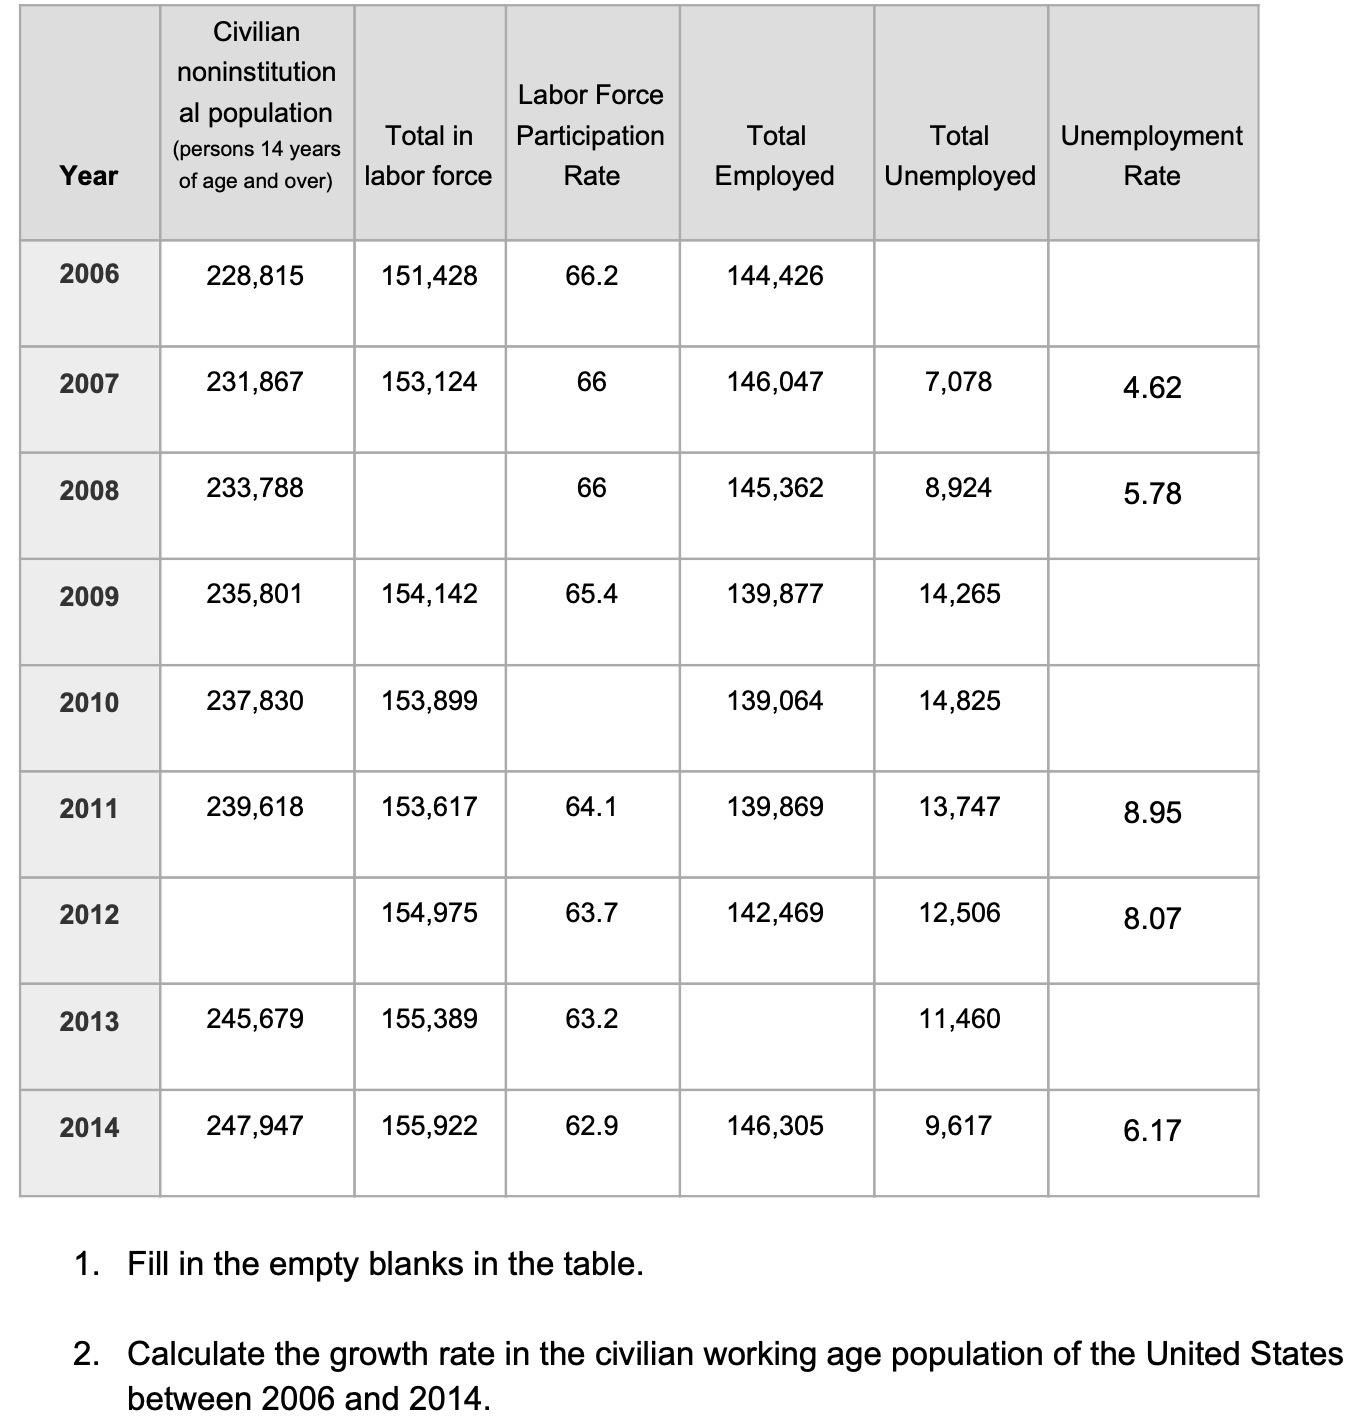
Civilian noninstitution al population Labor Force (persons 14 years Total in Participation Total Total Unemployment Year of age and over) labor force Rate Employed Unemployed
Step by Step Solution
There are 3 Steps involved in it
Step: 1

Get Instant Access to Expert-Tailored Solutions
See step-by-step solutions with expert insights and AI powered tools for academic success
Step: 2

Step: 3
Ace Your Homework with AI
Get the answers you need in no time with our AI-driven, step-by-step assistance
Get Started
International economics
Authors: Robert J. Carbaugh
13th Edition
978-1439038949, 1439038945, 978-8131518823