

Answered step by step
Verified Expert Solution
Question
1 Approved Answer
Civilian workforce Year 2010 2011 2012 2013 2014 2015 2016 2017 2018 2019 2020 Jan 153484 153263 154381 155763 155352 157030 158342 159647 161068 163142
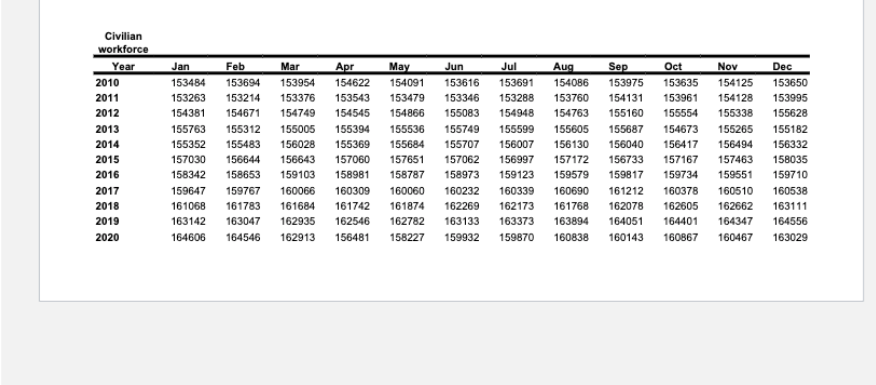
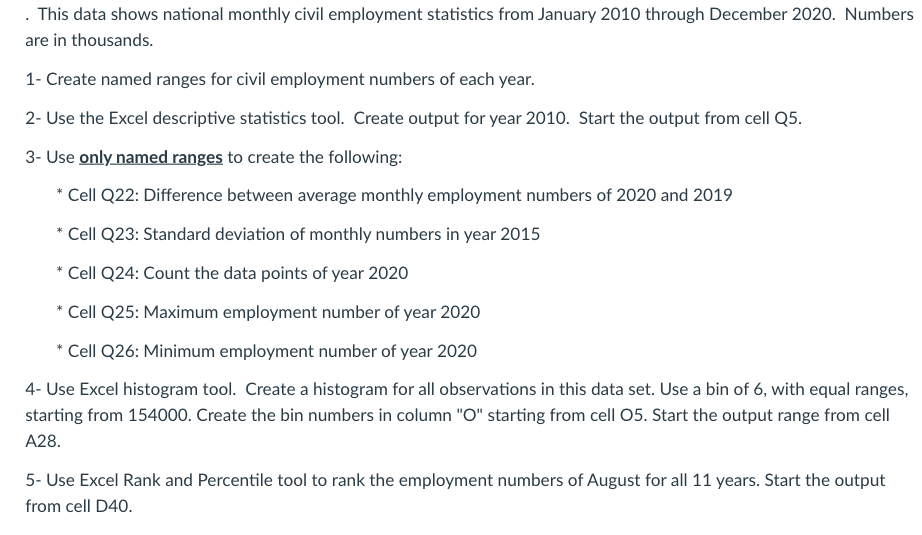
Civilian workforce Year 2010 2011 2012 2013 2014 2015 2016 2017 2018 2019 2020 Jan 153484 153263 154381 155763 155352 157030 158342 159647 161068 163142 164606 Feb 153694 153214 154671 155312 155483 156644 158653 159767 161783 163047 164546 Mar Apr 153954 154622 153376 153543 154749 154545 155005 155394 156028 155369 156643 157060 159103 158981 160066 160309 161684 161742 162935 162546 162913156481 May 154091 153479 154866 155536 155684 157651 158787 160060 161874 162782 158227 Jun 153616 153346 155083 155749 155707 157062 158973 160232 162269 163133 159932 Jul Aug 153691 154086 153288 153760 154948 154763 155599 155605 156007 156130 156997 157172 159123 159579 160339 160690 162173 161768 163373 163894 159870160838 Sep 153975 154131 155160 155687 156040 156733 159817 161212 162078 164051 160143 Oct 153635 153961 155554 154673 156417 157167 159734 160378 162605 164401 160867 Nov 154125 154128 155338 155265 156494 157463 159551 160510 162662 164347 160467 Dec 153650 153995 155628 155182 156332 158035 159710 160538 163111 164556 163029 . This data shows national monthly civil employment statistics from January 2010 through December 2020. Numbers are in thousands * 1- Create named ranges for civil employment numbers of each year. 2- Use the Excel descriptive statistics tool. Create output for year 2010. Start the output from cell Q5. 3- Use only named ranges to create the following: Cell Q22: Difference between average monthly employment numbers of 2020 and 2019 Cell Q23: Standard deviation of monthly numbers in year 2015 Cell Q24: Count the data points of year 2020 Cell Q25: Maximum employment number of year 2020 Cell Q26: Minimum employment number of year 2020 4- Use Excel histogram tool. Create a histogram for all observations in this data set. Use a bin of 6, with equal ranges, starting from 154000. Create the bin numbers in column "O" starting from cell 05. Start the output range from cell A28. 5- Use Excel Rank and Percentile tool to rank the employment numbers of August for all 11 years. Start the output from cell D40
Step by Step Solution
There are 3 Steps involved in it
Step: 1

Get Instant Access to Expert-Tailored Solutions
See step-by-step solutions with expert insights and AI powered tools for academic success
Step: 2

Step: 3
Ace Your Homework with AI
Get the answers you need in no time with our AI-driven, step-by-step assistance
Get Started
Behind Closed Doors What Company Audit Is Really About
Authors: V. Beattie, R. Brandt, S. Fearnley
2001 Edition
0333747844, 978-0333747841