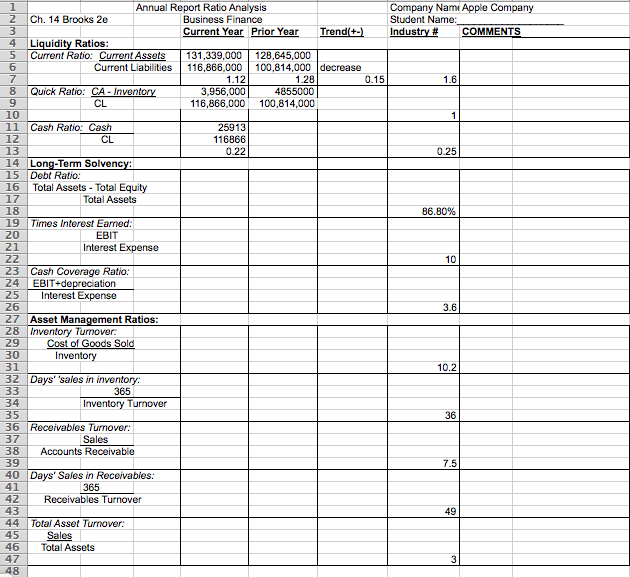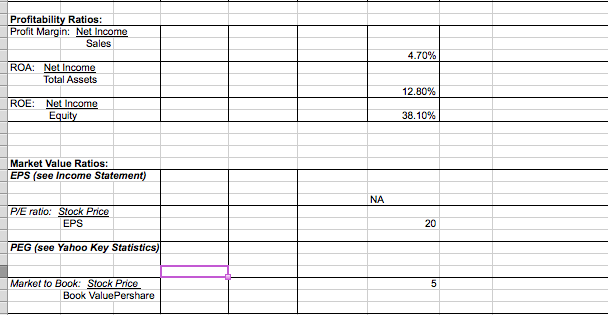

CL Annual Report Ratio Analysis Company Nami Apple Company 2 Ch. 14 Brooks 2e Business Finance Student Name: 3 Current Year Prior Year Trend(+-) Industry # COMMENTS 4 Liquidity Ratios: 5 Current Ratio: Current Assets 131,339,000 128,645,000 Current Liabilities 116,866,000 100,814,000 decrease 1.12 1.28 0.15 1.6 8 Quick Ratio: CA - Inventory 3,956,000 4855000 9 116,866,000 100,814,000 10 11 Cash Ratio: Cash 259131 12 116866 13 0.221 14 Long-Term Solvency: 15 Debt Ratio: 16 Total Assets - Total Equity 17 Total Assets 18 36.80% 19 Times Interest Earned: CL EBIT 20 21 101 Interest Expense 22 23 Cash Coverage Ratio: 24 EBIT+depreciation 25 Interest Expense 26 27 Asset Management Ratios: 28 Inventory Turnover: 29 Cost of Goods Sold 30 Inventory 31 32 Days' sales in inventory: 365 Inventory Turnover 35 36 Receivables Turnover: 37 Sales 38 Accounts Receivable 10.21 33 34 39 365 40 Days' Sales in Receivables: 41 42 Receivables Turnover 43 44 Total Asset Turnover: 45 Sales 46 Total Assets 47 48 Profitability Ratios: Profit Margin: Net Income Sales 4 70% ROA: Net Income Total Assets ROE: Net Income Equity 12.80% 38.10% Market Value Ratios: EPS (see Income Statement) NA P/E ratio: Stock Price EPS 20 PEG (see Yahoo Key Statistics) 5 Market to Book: Stock Price Book ValuePershare CL Annual Report Ratio Analysis Company Nami Apple Company 2 Ch. 14 Brooks 2e Business Finance Student Name: 3 Current Year Prior Year Trend(+-) Industry # COMMENTS 4 Liquidity Ratios: 5 Current Ratio: Current Assets 131,339,000 128,645,000 Current Liabilities 116,866,000 100,814,000 decrease 1.12 1.28 0.15 1.6 8 Quick Ratio: CA - Inventory 3,956,000 4855000 9 116,866,000 100,814,000 10 11 Cash Ratio: Cash 259131 12 116866 13 0.221 14 Long-Term Solvency: 15 Debt Ratio: 16 Total Assets - Total Equity 17 Total Assets 18 36.80% 19 Times Interest Earned: CL EBIT 20 21 101 Interest Expense 22 23 Cash Coverage Ratio: 24 EBIT+depreciation 25 Interest Expense 26 27 Asset Management Ratios: 28 Inventory Turnover: 29 Cost of Goods Sold 30 Inventory 31 32 Days' sales in inventory: 365 Inventory Turnover 35 36 Receivables Turnover: 37 Sales 38 Accounts Receivable 10.21 33 34 39 365 40 Days' Sales in Receivables: 41 42 Receivables Turnover 43 44 Total Asset Turnover: 45 Sales 46 Total Assets 47 48 Profitability Ratios: Profit Margin: Net Income Sales 4 70% ROA: Net Income Total Assets ROE: Net Income Equity 12.80% 38.10% Market Value Ratios: EPS (see Income Statement) NA P/E ratio: Stock Price EPS 20 PEG (see Yahoo Key Statistics) 5 Market to Book: Stock Price Book ValuePershare


