Question: Classification is a form of data analysis where a model or classifier is constructed to predict class labels or types. Data classification is a two-phase
Classification is a form of data analysis where a model or classifier is constructed to predict class labels or types. Data classification is a two-phase process, 1) a learning phase in which the classifier is built and 2) a classifying phase where the determination of the class type of given data is performed. With this project, students will be able to address problems in the two phases of classification, by implementing a basic algorithm to construct a classifier and by determining the class labels of given data tuples.
Problem
Our textbook describes in its Section 8.2.1 a basic algorithm for inducing a decision tree from training tuples. The algorithm follows a top down approach, similar to how decision trees are constructed by algorithms such as ID3, C4.5 and CART.
Part 1
Write a Java program that implements the basic algorithm for inducing a decision tree.
Note the following requirements:
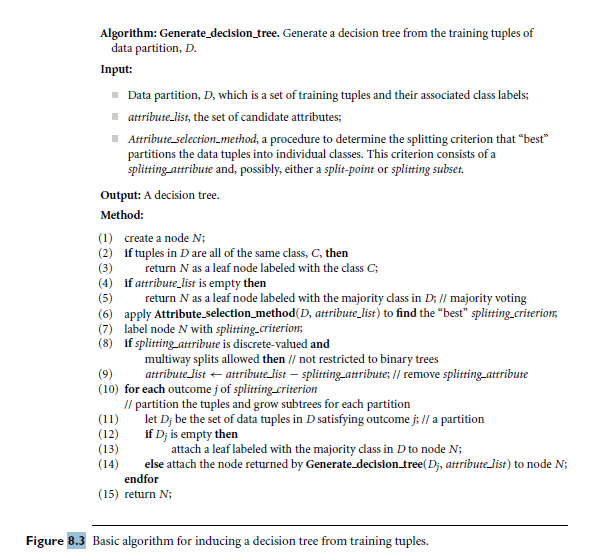
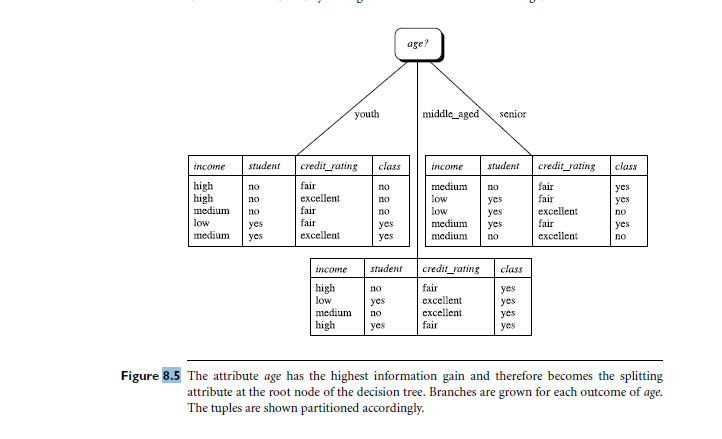
-You are not required to fully implement the algorithm as given in pages 332 335, but to implement the partition that occurs at the root node, i.e. the generation of the first level after the root. Use the description in Figure 8.3 for the algorithm steps, page 333, and the illustration in Figure 8.5 as a reference of the expected output.
-Consider the splitting attribute to be discrete-valued and use information gain as the attribute selection measure.
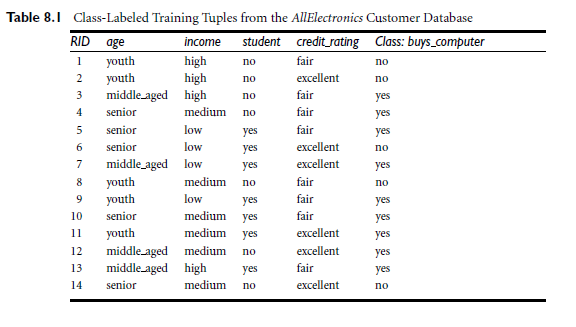
-Your implementation should use the training tuples given in Table 8.1, page 338 of the textbook. When run, the program should output the information given in Figure 8.5 (the output does not need to look exactly in the way shown there, but must convey the same meaning).
Part 2
Test the implementation in Part 2 by asking the user to enter a tuple and letting the model determine the class label for the tuple.
REFERENCES
8.2.1 Decision Tree Induction
During the late 1970s and early 1980s, J. Ross Quinlan, a researcher in machine learning, developed a decision tree algorithm known as ID3 (Iterative Dichotomiser). This work expanded on earlier work on concept learning systems, described by E. B. Hunt, J. Marin, and P. T. Stone. Quinlan later presented C4.5 (a successor of ID3), which became a benchmark to which newer supervised learning algorithms are often compared. In 1984, a group of statisticians (L. Breiman, J. Friedman, R. Olshen, and C. Stone) published the book Classification and Regression Trees (CART), which described the generation of binary decision trees. ID3 and CART were invented independently of one another at around the same time, yet follow a similar approach for learning decision trees from training tuples. These two cornerstone algorithms spawned a flurry of work on decision tree induction. ID3, C4.5, and CART adopt a greedy (i.e., nonbacktracking) approach in which decision trees are constructed in a top-down recursive divide-and-conquer manner. Most algorithms for decision tree induction also follow a top-down approach, which starts with a training set of tuples and their associated class labels. The training set is recursively partitioned into smaller subsets as the tree is being built. A basic decision tree algorithm is summarized in Figure 8.3. At first glance, the algorithm may appear long, but fear not! It is quite straightforward. The strategy is as follows. The algorithm is called with three parameters: D, attribute list, and Attribute selection method. We refer to D as a data partition. Initially, it is the complete set of training tuples and their associated class labels. The parameter attribute list is a list of attributes describing the tuples. Attribute selection method specifies a heuristic procedure for selecting the attribute that best discriminates the given tuples according to class. This procedure employs an attribute selection measure such as information gain or the Gini index. Whether the tree is strictly binary is generally driven by the attribute selection measure. Some attribute selection measures, such as the Gini index, enforce the resulting tree to be binary. Others, like information gain, do not, therein allowingmultiway splits (i.e., two or more branches to be grown from a node). The tree starts as a single node, N, representing the training tuples in D (step 1).3


Table 8, Class-Labeled Training Tuples from the AllElectronics Customer Database RID age income student credit rating Class: buys_computer youth no 2 youth 3 middle aged high no 4 senior excellent fair fair no medium no 5 senior excellent excellent 6 senior no 7 middle aged low medium no 8 youth no 9 youth 10 senior 11 youth 12 middle aged medium no 13 middle aged highyes 14 senior fair fair excellent excellent fair excellent medium yes medium yes medium no no
Step by Step Solution
There are 3 Steps involved in it

Get step-by-step solutions from verified subject matter experts


