Question
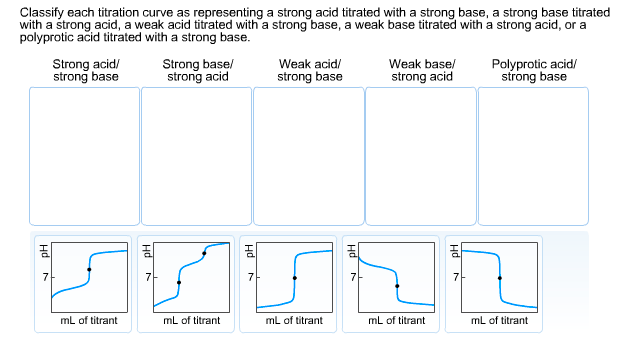
Classify each titration curve as representing a strong acid titrated with a strong base, a strong base titrated with a strong acid, a weak

Classify each titration curve as representing a strong acid titrated with a strong base, a strong base titrated with a strong acid, a weak acid titrated with a strong base, a weak base titrated with a strong acid, or a polyprotic acid titrated with a strong base. Strong acid/ strong base Strong base/ strong acid mL of titrant Weak acid/ strong base mL of titrant FYSAL mL of titrant Weak base/ strong acid 7 mL of titrant Polyprotic acid/ strong base 7 mL of titrant
Step by Step Solution
3.48 Rating (161 Votes )
There are 3 Steps involved in it
Step: 1

Get Instant Access to Expert-Tailored Solutions
See step-by-step solutions with expert insights and AI powered tools for academic success
Step: 2

Step: 3

Ace Your Homework with AI
Get the answers you need in no time with our AI-driven, step-by-step assistance
Get StartedRecommended Textbook for
Chemical Principles
Authors: Steven S. Zumdahl, Donald J. DeCoste
7th edition
9781133109235, 1111580650, 978-1111580650
Students also viewed these Chemistry questions
Question
Answered: 1 week ago
Question
Answered: 1 week ago
Question
Answered: 1 week ago
Question
Answered: 1 week ago
Question
Answered: 1 week ago
Question
Answered: 1 week ago
Question
Answered: 1 week ago
Question
Answered: 1 week ago
Question
Answered: 1 week ago
Question
Answered: 1 week ago
Question
Answered: 1 week ago
Question
Answered: 1 week ago
Question
Answered: 1 week ago
Question
Answered: 1 week ago
Question
Answered: 1 week ago
Question
Answered: 1 week ago
Question
Answered: 1 week ago
Question
Answered: 1 week ago
Question
Answered: 1 week ago
Question
Answered: 1 week ago
Question
Answered: 1 week ago
Question
Answered: 1 week ago
Question
Answered: 1 week ago
View Answer in SolutionInn App


