Answered step by step
Verified Expert Solution
Question
1 Approved Answer
clear answer in order thank you Current Attempt in Progress Cepeda Manufacturing Company is considering three new projects, each requiring an equipment investment of $22,000.
clear answer in order thank you 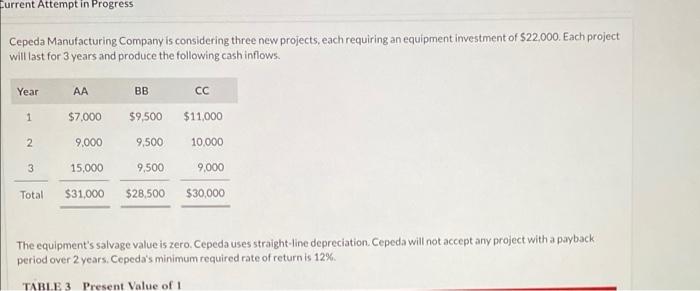
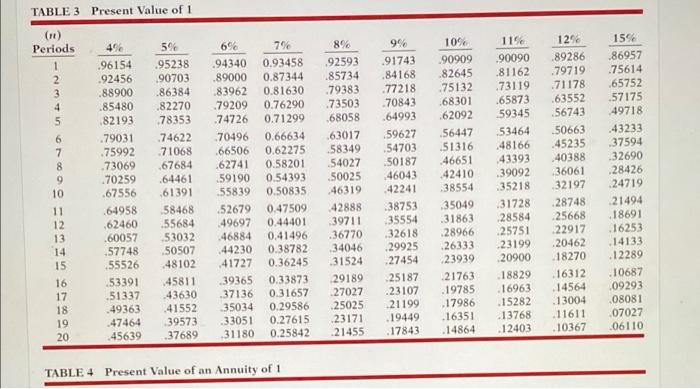
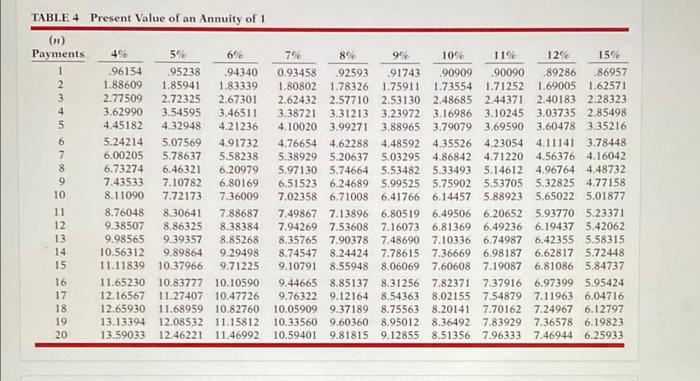
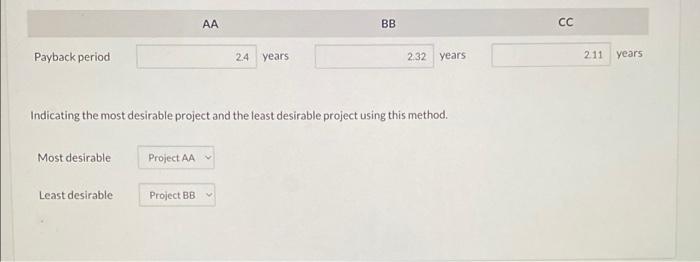
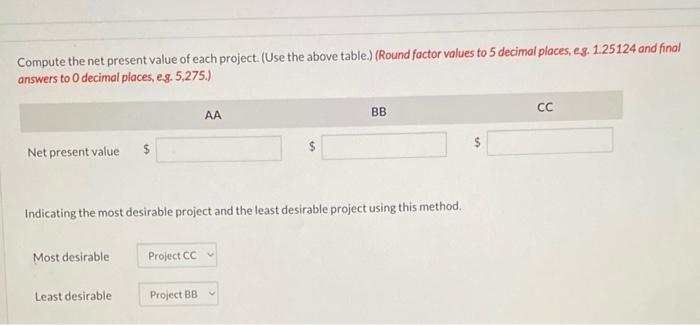
Current Attempt in Progress Cepeda Manufacturing Company is considering three new projects, each requiring an equipment investment of $22,000. Each project will last for 3 years and produce the following cash inflows. Year AA BB cc 1 $7,000 $9,500 $11,000 2 9,000 9,500 10,000 3 15,000 9,500 9,000 Total $31,000 $28,500 $30,000 The equipment's salvage value is zero. Cepeda uses straight-line depreciation. Cepeda will not accept any project with a payback period over 2 years. Cepeda's minimum required rate of return is 12%. TABLE 3 Present Value of 1 TABLE 3 Present Value of 1 (n) Periods 4% 5% 6% 8% 7% 0.93458 1 .96154 .95238 92593 94340 .89000 0.87344 2 92456 90703 .85734 .88900 83962 0.81630 79383 .86384 85480 .82270 79209 73503 0.76290 74726 0.71299 68058 5 82193 78353 6 .79031 .74622 70496 0.66634 63017 7 .75992 71068 .66506 0.62275 58349 8 73069 67684 .62741 0.58201 54027 9 .70259 .64461 59190 0.54393 50025 10 .67556 61391 55839 0.50835 46319 11 .64958 58468 52679 0.47509 42888 12 62460 55684 49697 0.44401 39711 13 .60057 53032 46884 0.41496 .36770 14 57748 50507 44230 0.38782 34046 15 55526 48102 41727 0.36245 31524 16 53391 45811 39365 0.33873 29189 17 51337 43630 37136 0.31657 27027 18 49363 41552 35034 0.29586 25025 19 47464 39573 33051 0.27615 23171 20 45639 37689 31180 0.25842 21455 TABLE4 Present Value of an Annuity of 1 3 4 9% 10% 11% 12% 91743 .90090 .90909 .89286 .84168 .82645 .81162 .79719 77218 75132 73119 71178 70843 68301 .65873 .63552 .64993 .62092 59345 .56743 59627 56447 53464 50663 54703 51316 48166 45235 50187 46651 43393 40388 46043 42410 .39092 36061 42241 38554 35218 32197 38753 35049 31728 28748 35554 31863 28584 25668 32618 28966 25751 22917 29925 .26333 23199 20462 27454 23939 20900 18270 25187 21763 18829 16312 .23107 19785 16963 14564 21199 17986 15282 13004 19449 .16351 13768 11611 17843 14864 12403 10367 15% 86957 75614 65752 57175 49718 43233 37594 32690 28426 24719 21494 .18691 16253 14133 12289 .10687 09293 08081 07027 06110 TABLE4 Present Value of an Annuity of 1 (n) Payments 4% 5% 6% 7% 8% 11% 12% 15% 9% 10% 91743 .90909 .90090 1 .89286 .86957 1.73554 1.71252 1.69005 1.62571 3 4 8 9 10 96154 95238 94340 0.93458 .92593 1.88609 1.85941 1.83339 1.80802 1.78326 1.75911 2.77509 2.72325 2.67301 2.62432 2.57710 2.53130 2.48685 2.44371 2.40183 2.28323 3.62990 3.54595 3.46511 3.38721 3.31213 3.23972 3.16986 3.10245 3.03735 2.85498 4.45182 4.32948 4.21236 4.10020 3.99271 3.88965 3.79079 3.69590 3.60478 3.35216 5.24214 5.07569 4.91732 4.76654 4.62288 4.48592 4.35526 4.23054 4.11141 3.78448 6.00205 5.78637 5.58238 5.38929 5.20637 5.03295 4.86842 4.71220 4.56376 4.16042 6.73274 6.46321 6.20979 5.97130 5.74664 5.53482 5.33493 5.14612 4.96764 4.48732 7.43533 7.10782 6.80169 6.51523 6.24689 5.99525 5.75902 5.53705 5.32825 4.77158 8.11090 7.72173 7.36009 7.02358 6.71008 6.41766 6.14457 5.88923 5.65022 5.01877 8.76048 8.30641 7.88687 7.49867 7.13896 6.80519 6.49506 6.20652 5.93770 5.23371 9.38507 8.86325 8.38384 7.94269 7.53608 7.16073 6.81369 6.49236 6.19437 5.42062 9.98565 9.39357 8.85268 8.35765 7.90378 7.48690 7.10336 6.74987 6.42355 5.58315 10.56312 9.89864 9.29498 8.74547 8.24424 7.78615 7.36669 6.98187 6.62817 5.72448 11.11839 10.37966 9.71225 9.10791 8.55948 8.06069 7.60608 7.19087 6.81086 5.84737 11.65230 10.83777 10.10590 9.44665 8.85137 8.31256 7.82371 7.37916 6.97399 5.95424 12.16567 11.27407 10.47726 9.76322 9.12164 8.54363 8.02155 7.54879 7.11963 6.04716 12.65930 11.68959 10.82760 10.05909 9.37189 8.75563 8.20141 7.70162 7.24967 6.12797 13.13394 12.08532 11.15812 10.33560 9.60360 8.95012 8.36492 7.83929 7.36578 6.19823 13.59033 12.46221 11.46992 10.59401 9.81815 9.12855 8.51356 7.96333 7.46944 6.25933 11 12 13 14 15 16 17 18 19 20 567 AA BB Payback period 24 years 2.32 years Indicating the most desirable project and the least desirable project using this method. Most desirable Project AA Least desirable Project BB CC 2.11 years Compute the net present value of each project. (Use the above table.) (Round factor values to 5 decimal places, e.g. 1.25124 and final answers to 0 decimal places, e.g. 5,275.) AA BB CC Net present value $ Indicating the most desirable project and the least desirable project using this method. Most desirable Project CC Least desirable Project BB 


Step by Step Solution
There are 3 Steps involved in it
Step: 1

Get Instant Access to Expert-Tailored Solutions
See step-by-step solutions with expert insights and AI powered tools for academic success
Step: 2

Step: 3

Ace Your Homework with AI
Get the answers you need in no time with our AI-driven, step-by-step assistance
Get Started


