

Answered step by step
Verified Expert Solution
Question
1 Approved Answer
CLEAR STEPS PLZ EXAMPLE 18-3 Heating of Brass Plates in an Oven In a production facility, large brass plates of 4cm thickness that are initially
CLEAR STEPS PLZ
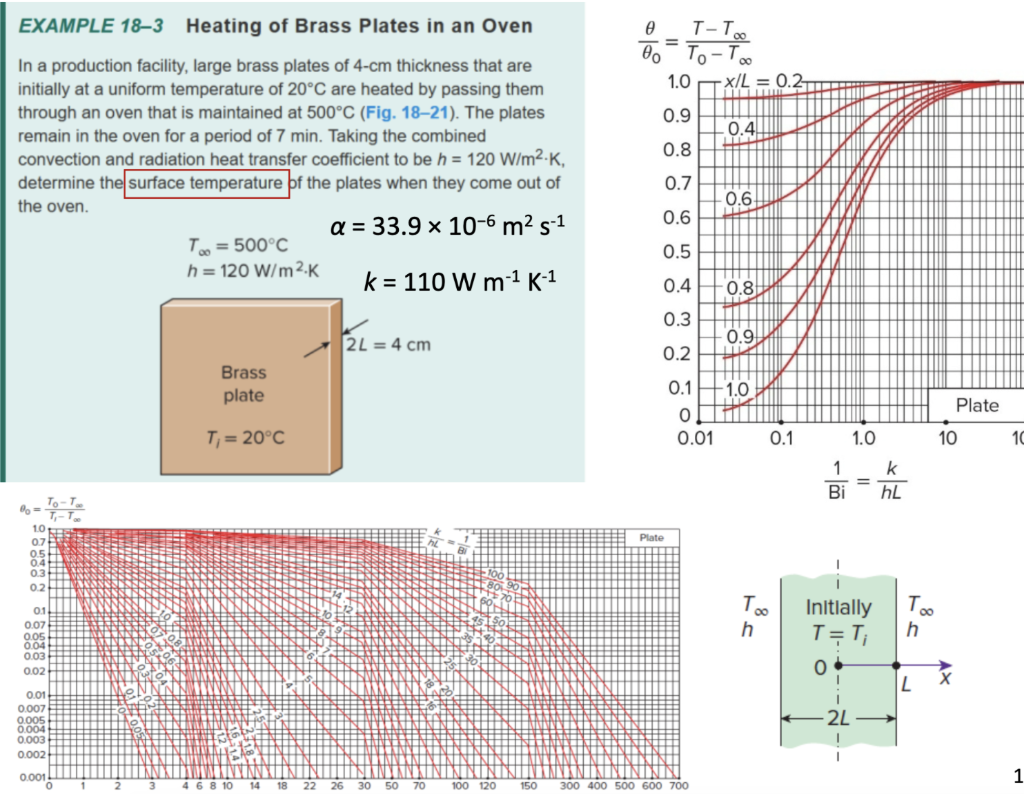
EXAMPLE 18-3 Heating of Brass Plates in an Oven In a production facility, large brass plates of 4cm thickness that are initially at a uniform temperature of 20C are heated by passing them through an oven that is maintained at 500C (Fig. 18-21). The plates remain in the oven for a period of 7min. Taking the combined convection and radiation heat transfer coefficient to be h=120W/m2K, determine the If the plates when they come out of the oven. =33.9106m2s1h-101//m2vI1K1 Example 18-3. Cooling of a Long Stainless Steel Cylindrical Shaft. Determine the temperature at the center of the shaft after cooling for 45 minutes using a chart from the lecture slides. There are many charts in Lecture \#22 slides, but you will need only one of them for this solution. Again, small error is fine when you read from the chart. Since you are going after the temperature, you will read an y value from the chart. To do that, you need to know what line to follow (you need only one line out of many given lines) and what non-dimensional time you have. EXAMPLE 18-3 Heating of Brass Plates in an Oven In a production facility, large brass plates of 4cm thickness that are initially at a uniform temperature of 20C are heated by passing them through an oven that is maintained at 500C (Fig. 18-21). The plates remain in the oven for a period of 7min. Taking the combined convection and radiation heat transfer coefficient to be h=120W/m2K, determine the If the plates when they come out of the oven. =33.9106m2s1h-101//m2vI1K1 Example 18-3. Cooling of a Long Stainless Steel Cylindrical Shaft. Determine the temperature at the center of the shaft after cooling for 45 minutes using a chart from the lecture slides. There are many charts in Lecture \#22 slides, but you will need only one of them for this solution. Again, small error is fine when you read from the chart. Since you are going after the temperature, you will read an y value from the chart. To do that, you need to know what line to follow (you need only one line out of many given lines) and what non-dimensional time you haveStep by Step Solution
There are 3 Steps involved in it
Step: 1

Get Instant Access to Expert-Tailored Solutions
See step-by-step solutions with expert insights and AI powered tools for academic success
Step: 2

Step: 3
Ace Your Homework with AI
Get the answers you need in no time with our AI-driven, step-by-step assistance
Get Started
Transport Processes And Separation Process Principles
Authors: Christie Geankoplis, Allen Hersel, Daniel Lepek
5th Edition
0134181026, 978-0134181028