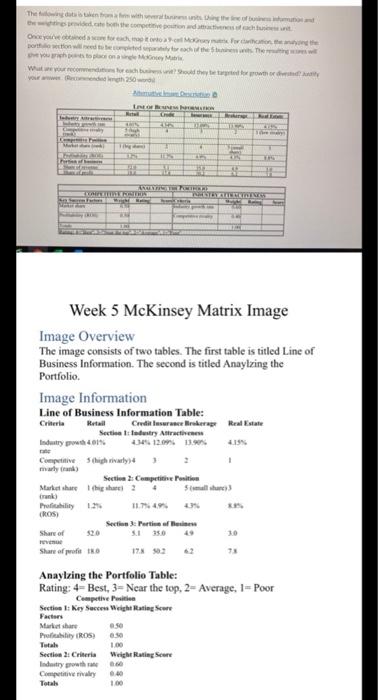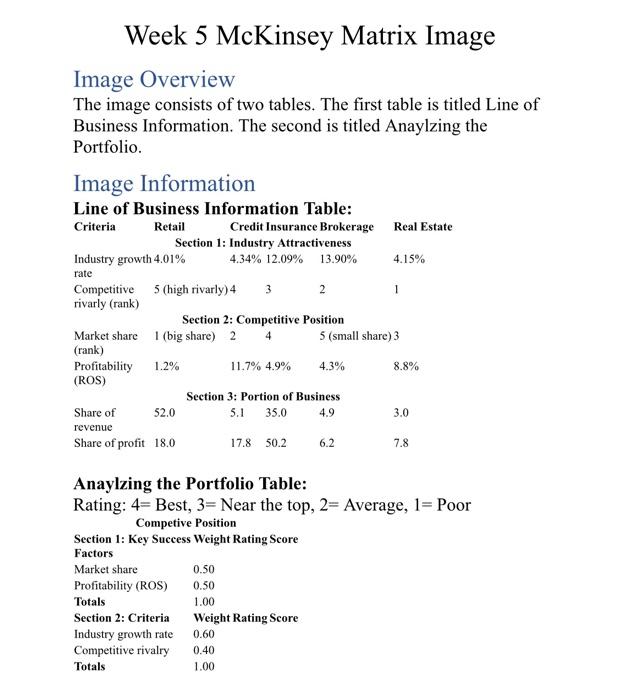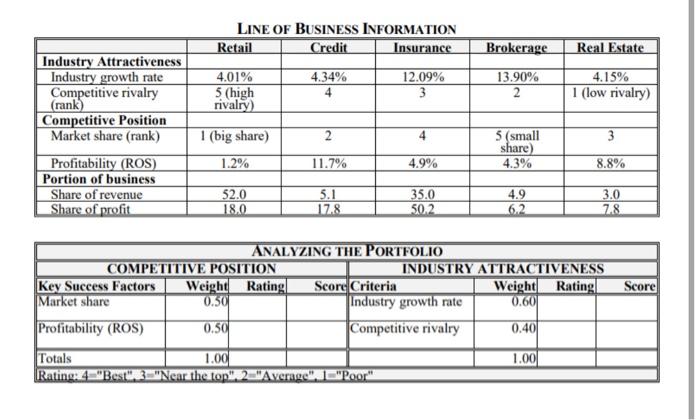
become the chi Once you for each month Dortowe foreach the them Wat we werden unter and they were the remode You dech 250 TE ERICIRE INTELLIGE Week 5 McKinsey Matrix Image Image Overview The image consists of two tables. The first table is titled Line of Business Information. The second is titled Anayizing the Portfolio Image Information Line of Business Information Table: Cri Retail Credit Insurance kerage Real Estate Sectistry Attractive Industry 401 04.12.09 13.90% Competitive high vary) 1 malyan) Section 2: Cempetitie Tonite Market share this 24 rank) Profily ROS) 3.135.0 Share of re Share of profiel 17 03 73 Anaylzing the Portfolio Table: Rating: 4-Best, 3= Near the top, 2-Average. I= Poor Competitie Section 1: Key Success Weight Rating Score Factors Marthare Pretty ROS) Tutte 1.00 Section 2: Criteria Weight Rating Score Industry growth rate Competitie Total 100 Week 5 McKinsey Matrix Image Image Overview The image consists of two tables. The first table is titled Line of Business Information. The second is titled Anaylzing the Portfolio. Image Information Line of Business Information Table: Criteria Retail Credit Insurance Brokerage Real Estate Section 1: Industry Attractiveness Industry growth 4.01% 4.34% 12.09% 4.15% rate Competitive 5 (high rivarly) 4 2 rivarly (rank) Section 2: Competitive Position Market share 1 (big share) 2 4 5 (small share) 3 (rank) Profitability 1.2% 11.7% 4.9% 4.3% 8.8% (ROS) Section 3: Portion of Business Share of 13.90% 3 1 52.0 5.1 35.0 4.9 3.0 revenue Share of profit 18.0 17.8 50.2 6.2 7.8 Anaylzing the Portfolio Table: Rating: 4= Best, 3= Near the top, 2= Average, 1= Poor Competive Position Section 1: Key Success Weight Rating Score Factors Market share Profitability (ROS) 0.50 Totals 1.00 Section 2: Criteria Weight Rating Score Industry growth rate Competitive rivalry 0.40 Totals 1.00 0.50 0.60 LINE OF BUSINESS INFORMATION Retail Credit Insurance Brokerage Real Estate 4.01% 5 (high rivalry) 4.34% 4 12.09% 3 13.90% 2 4.15% 1 (low rivalry) Industry Attractiveness Industry growth rate Competitive rivalry (rank) Competitive Position Market share (rank) Profitability (ROS) Portion of business Share of revenue Share of profit 1 (big share) 2 4 3 5 (small share) 4.3% 1.2% 11.7% 4.9% 8.8% 4.9 52.0 18.0 5.1 17.8 35.0 50.2 3.0 7.8 Score ANALYZING THE PORTFOLIO COMPETITIVE POSITION INDUSTRY ATTRACTIVENESS Key Success Factors Weight Rating Score Criteria Weight Rating| Market share 0.50 Industry growth rate 0.60 Profitability (ROS) 0.50 Competitive rivalry 0.401 Totals 1.001 1.00 Rating: 4 "Best3 "Near the top 2 Average 1 "Poor" become the chi Once you for each month Dortowe foreach the them Wat we werden unter and they were the remode You dech 250 TE ERICIRE INTELLIGE Week 5 McKinsey Matrix Image Image Overview The image consists of two tables. The first table is titled Line of Business Information. The second is titled Anayizing the Portfolio Image Information Line of Business Information Table: Cri Retail Credit Insurance kerage Real Estate Sectistry Attractive Industry 401 04.12.09 13.90% Competitive high vary) 1 malyan) Section 2: Cempetitie Tonite Market share this 24 rank) Profily ROS) 3.135.0 Share of re Share of profiel 17 03 73 Anaylzing the Portfolio Table: Rating: 4-Best, 3= Near the top, 2-Average. I= Poor Competitie Section 1: Key Success Weight Rating Score Factors Marthare Pretty ROS) Tutte 1.00 Section 2: Criteria Weight Rating Score Industry growth rate Competitie Total 100 Week 5 McKinsey Matrix Image Image Overview The image consists of two tables. The first table is titled Line of Business Information. The second is titled Anaylzing the Portfolio. Image Information Line of Business Information Table: Criteria Retail Credit Insurance Brokerage Real Estate Section 1: Industry Attractiveness Industry growth 4.01% 4.34% 12.09% 4.15% rate Competitive 5 (high rivarly) 4 2 rivarly (rank) Section 2: Competitive Position Market share 1 (big share) 2 4 5 (small share) 3 (rank) Profitability 1.2% 11.7% 4.9% 4.3% 8.8% (ROS) Section 3: Portion of Business Share of 13.90% 3 1 52.0 5.1 35.0 4.9 3.0 revenue Share of profit 18.0 17.8 50.2 6.2 7.8 Anaylzing the Portfolio Table: Rating: 4= Best, 3= Near the top, 2= Average, 1= Poor Competive Position Section 1: Key Success Weight Rating Score Factors Market share Profitability (ROS) 0.50 Totals 1.00 Section 2: Criteria Weight Rating Score Industry growth rate Competitive rivalry 0.40 Totals 1.00 0.50 0.60 LINE OF BUSINESS INFORMATION Retail Credit Insurance Brokerage Real Estate 4.01% 5 (high rivalry) 4.34% 4 12.09% 3 13.90% 2 4.15% 1 (low rivalry) Industry Attractiveness Industry growth rate Competitive rivalry (rank) Competitive Position Market share (rank) Profitability (ROS) Portion of business Share of revenue Share of profit 1 (big share) 2 4 3 5 (small share) 4.3% 1.2% 11.7% 4.9% 8.8% 4.9 52.0 18.0 5.1 17.8 35.0 50.2 3.0 7.8 Score ANALYZING THE PORTFOLIO COMPETITIVE POSITION INDUSTRY ATTRACTIVENESS Key Success Factors Weight Rating Score Criteria Weight Rating| Market share 0.50 Industry growth rate 0.60 Profitability (ROS) 0.50 Competitive rivalry 0.401 Totals 1.001 1.00 Rating: 4 "Best3 "Near the top 2 Average 1 "Poor


