CLEP practice question - this is not a school question - DO NOT REPORT
Question: Conduct the attached One Way Anova Test on the relationship between schools' poverty level and performance on the keystone math test by using the data provided to you from the Pennsylvania Department of Education.
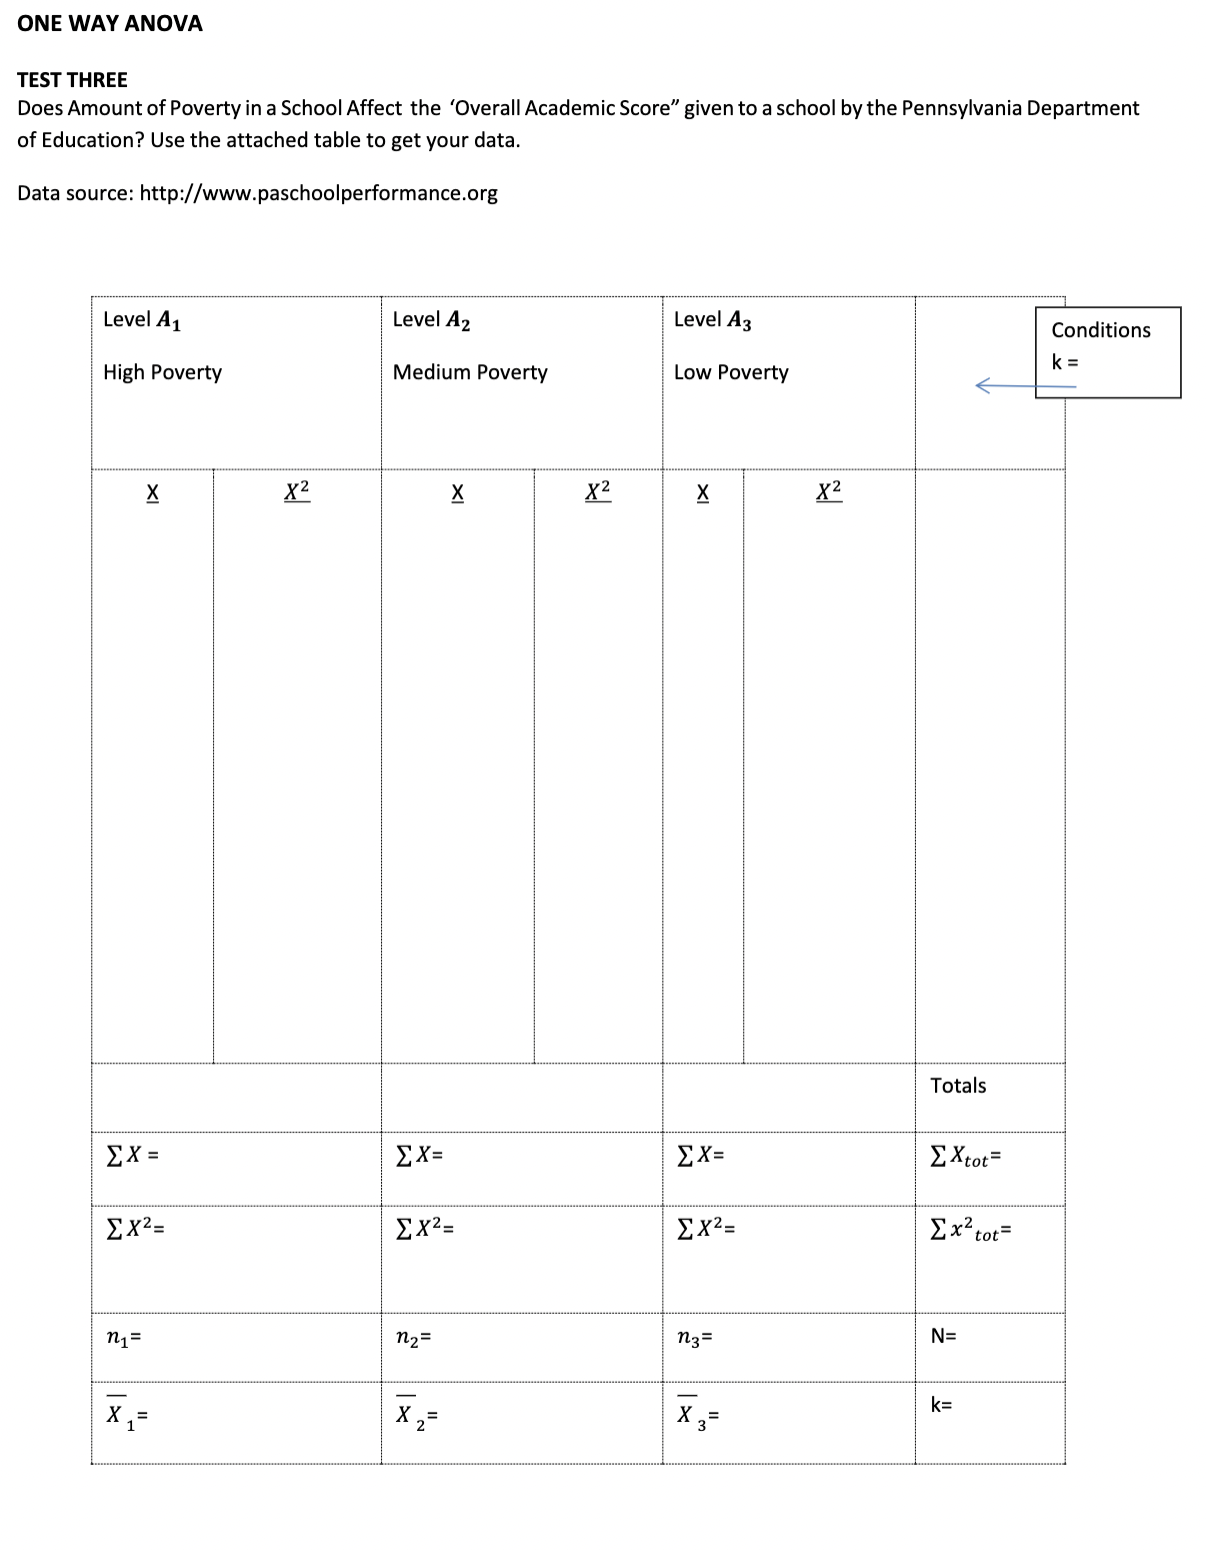
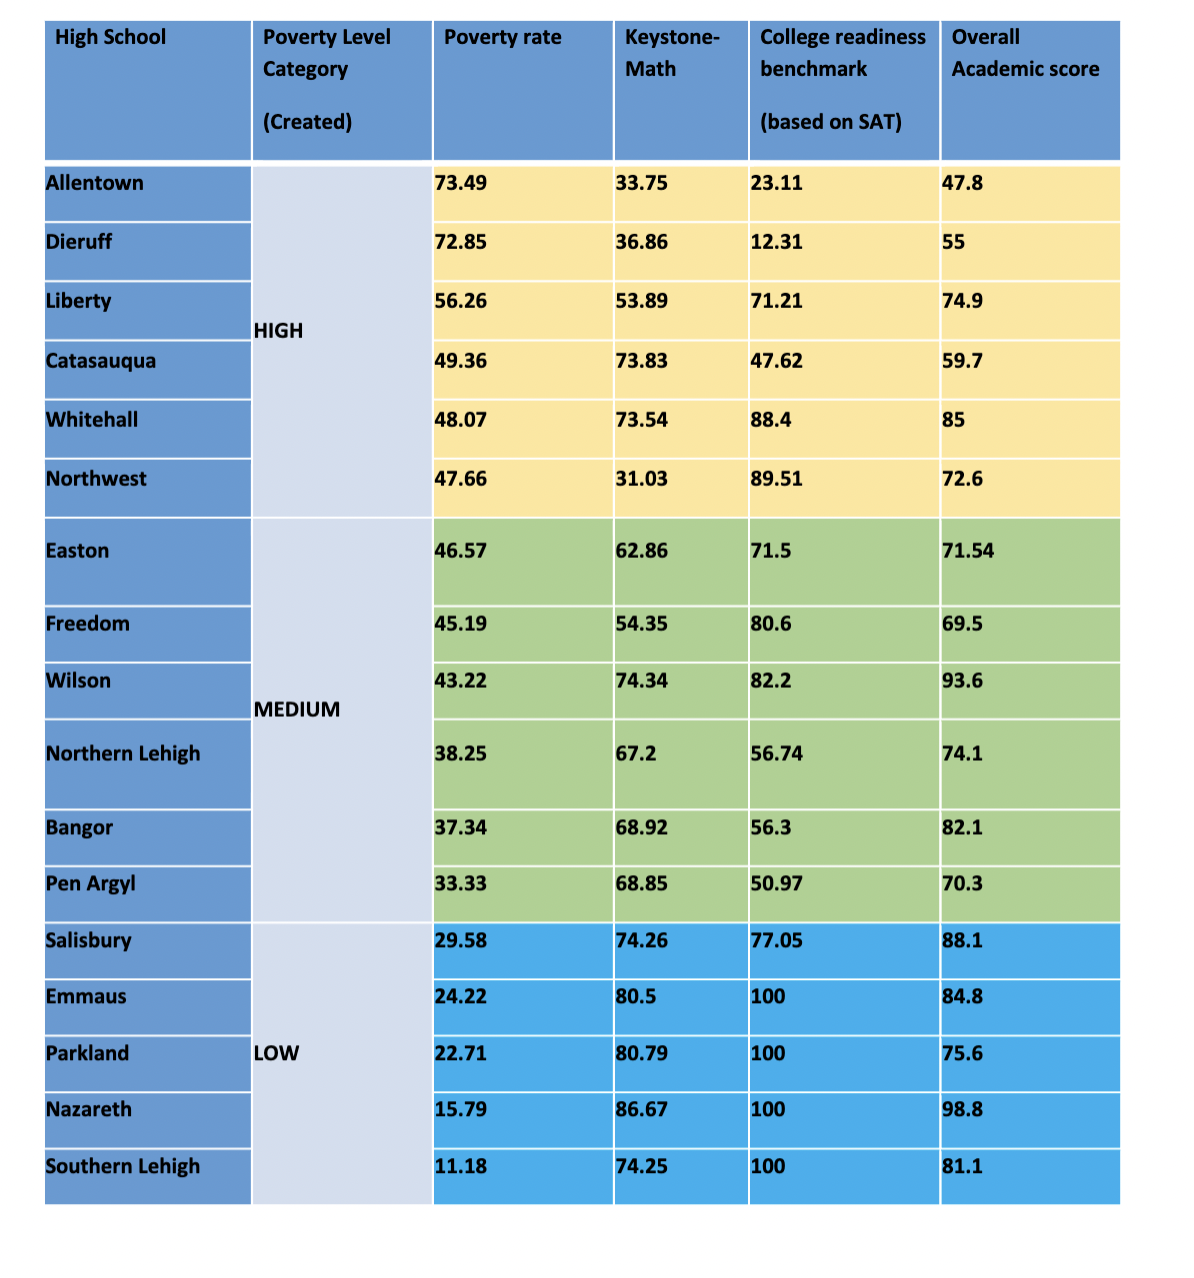
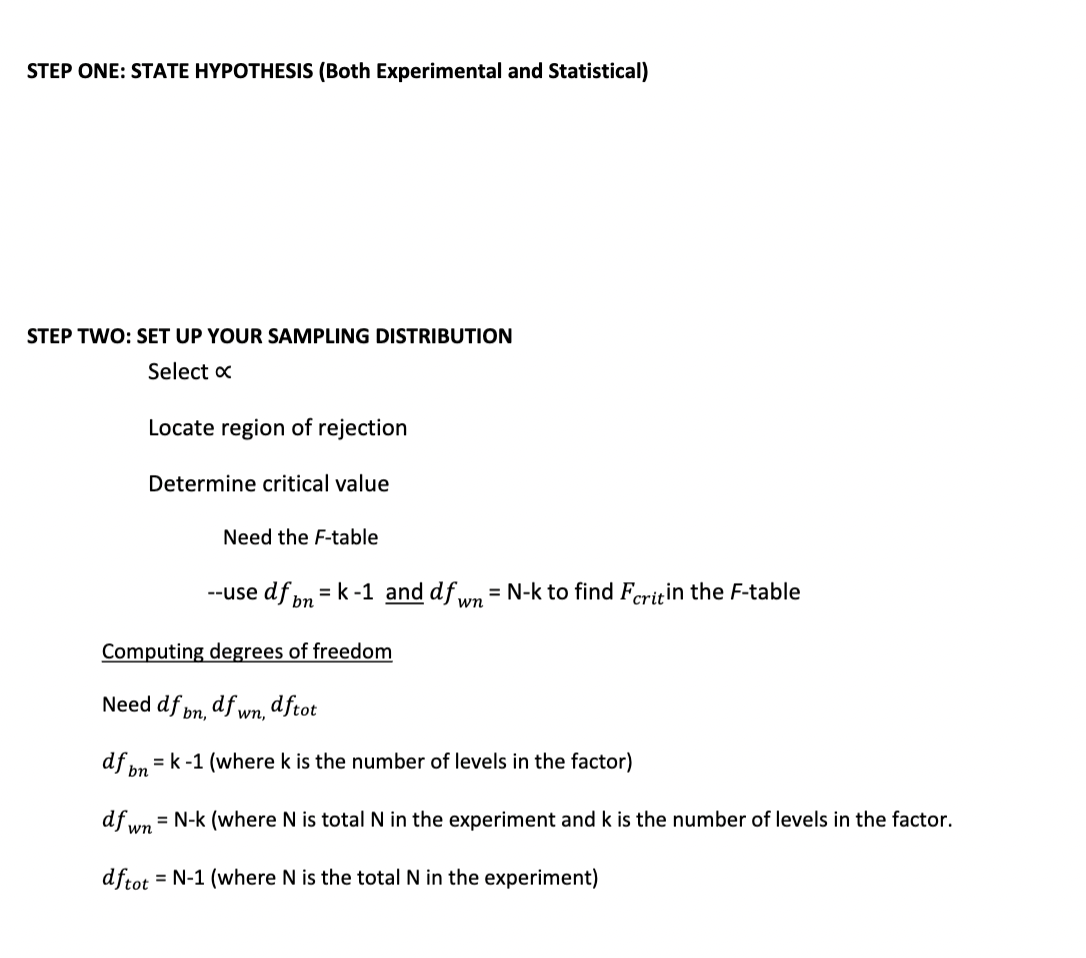
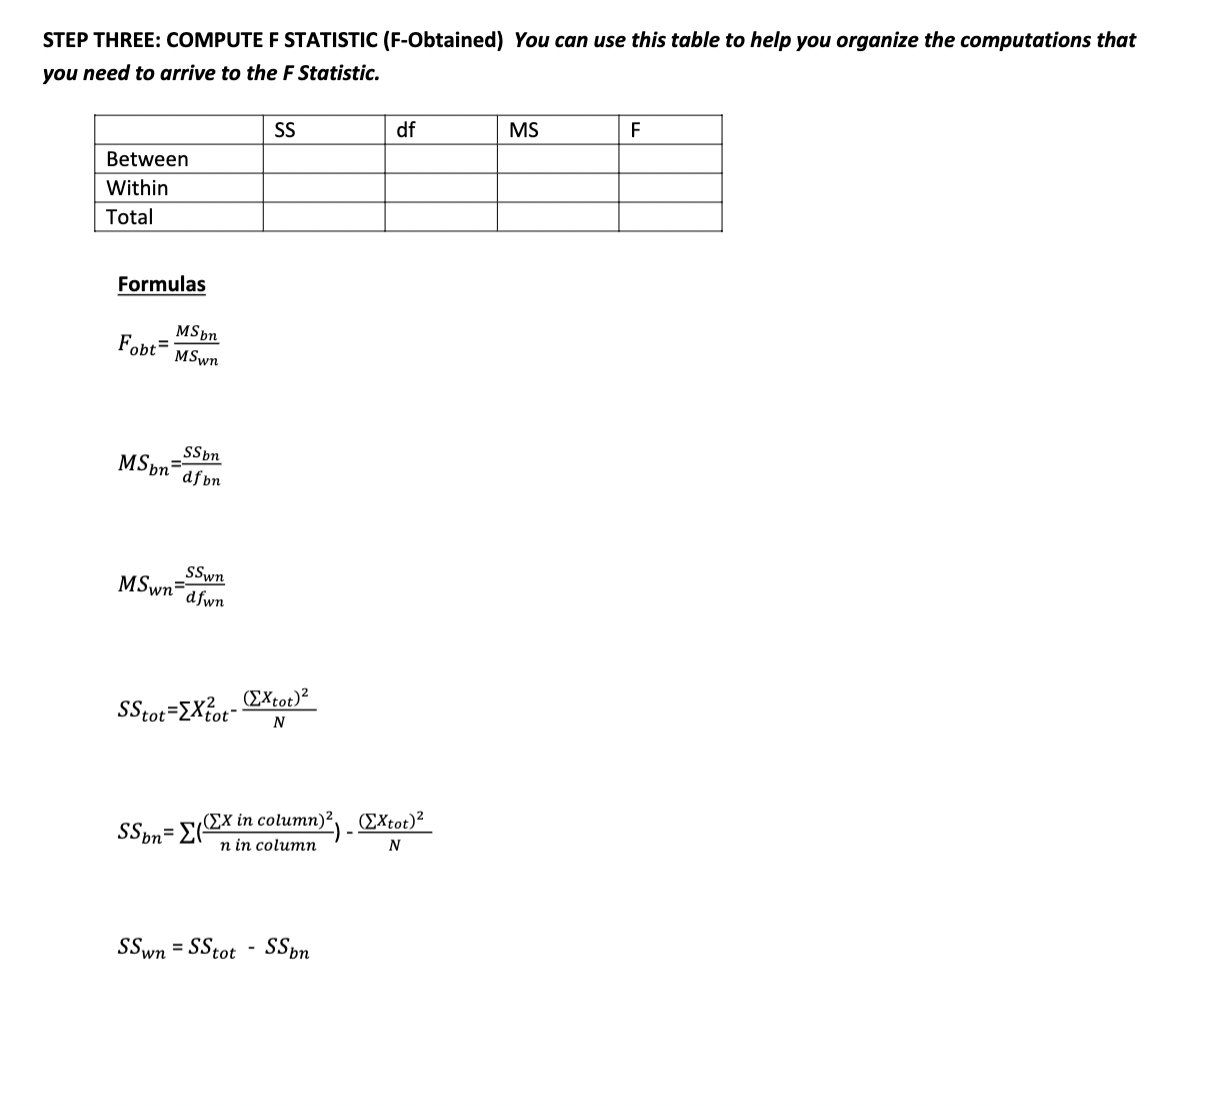
ONE WAY ANOVA TEST THREE Does Amount of Poverty in a School Affect the 'Overall Academic Score" given to a school by the Pennsylvania Department of Education? Use the attached table to get your data. Data source: http://www.paschoolperformance.org Level A1 Level A2 Level A3 Conditions High Poverty Medium Poverty Low Poverty K = X X2 X X2 X X2 Totals EX = EX= EX= EXtot= EX2= EX2= EX2= Ex tot= n1= n2= n3= N= X = X 2 = X 2 = K=High School Poverty Level Poverty rate Keystone- College readiness Overall Category Math benchmark Academic score (Created) (based on SAT) Allentown 73.49 33.75 23.11 17.8 Dieruff 72.85 36.86 12.31 55 Liberty 56.26 53.89 71.21 74.9 HIGH Catasauqua 49.36 73.83 47.62 59.7 Whitehall 48.07 73.54 88.4 85 Northwest 47.66 31.03 89.51 72.6 Easton 46.57 62.86 71.5 71.54 Freedom 45.19 54.35 80.6 69.5 Wilson 43.22 74.34 82.2 93.6 MEDIUM Northern Lehigh 38.25 67.2 56.74 74.1 Bangor 37.34 68.92 56.3 82.1 Pen Argyl 33.33 68.85 50.97 70.3 Salisbury 29.58 74.26 77.05 88.1 Emmaus 24.22 80.5 100 84.8 Parkland LOW 22.71 80.79 100 75.6 Nazareth 15.79 86.67 100 98.8 Southern Lehigh 11.18 74.25 100 81.1STEP ONE: STATE HYPOTHESIS (Both Experimental and Statistical) STEP TWO: SET UP YOUR SAMPLING DISTRIBUTION Select oc Locate region of rejection Determine critical value Need the F-table --use dfon = k-1 and df wn = N-k to find Foritin the F-table Computing degrees of freedom Need dfon, af wn, dftot df on = k-1 (where k is the number of levels in the factor) df wn = N-k (where N is total N in the experiment and k is the number of levels in the factor. dftot = N-1 (where N is the total N in the experiment)STEP THREE: COMPUTE F STATISTIC (F-Obtained) You can use this table to help you organize the computations that you need to arrive to the F Statistic. SS df MS F Between Within Total Formulas MS on Fobt MSwn SSon MSon dfon SSwn MSwn dfwn SStot=[X? _ (EXtot)2 N SSon= E(X in column)? ) - (Extot)2 n in column N SSwn = SStot - SSonSTEP FOUR: INTERPRET AND REPORT RESULTS Compare Fobt to Ferit State whether results are significant or non-significant and report results using standard format. CONDUCT POST HOC TEST (IF APPLICABLE) HSD (Honestly Significant Difference) HSD = (qk)( MSwry n n= number of scores in each level of the factor qk can be obtained on the last page of this packet. Level A1 Level A2 Level A3 Low poverty Moderate poverty High Poverty X 1 X 2 X3 Determine differences between each pair of means. Subtract each mean from every other mean. Ignore positive or negative because it is a two-tailed test. On the line connecting any two levels is the absolute difference between their means. Compare each difference to the HSD. If the absolute difference between two means is greater than the HSD then these means differ significantly.Effect Size (Eta Squared) 2 SSon SStot This is the proportion of variance in dependent scores that is accounted for by changing the levels of a factor). . Will be between 0 and 1, indicating the extent to which dependent scores change as the independent variable changes. . The larger the n2 the larger the role that factor plays in determining differences