clf format short e dat = load('gco2.dat'); year = dat(:,1); conc= dat(:,2); X = [ones(size(year)),year]; z = X'*conc; S = X'*X; U = chol(S); w

clf
format short e
dat = load('gco2.dat');
year = dat(:,1);
conc= dat(:,2);
X = [ones(size(year)),year];
z = X'*conc;
S = X'*X;
U = chol(S);
w = U'z;
c = Uw
plot(year,conc,'o')
q = year;
fit = c(1)+c(2)*q;
hold on
axis tight
plot(q,fit,'black', 'linewidth', 2);
xlabel('Year');
ylabel('Data');
legend('Actual data','Linear fit');
Question B


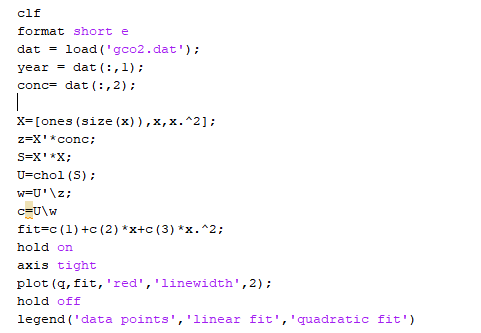
Please help i keep getting the error you see below. please help.

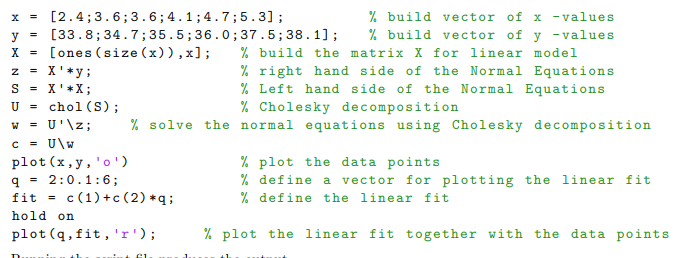
You will see in the follwing example 1 to go by alone with part A and part A code. I need help with part B. You can see part B code labeled as question B. I used this code but keep getting the error you see. please help.
x[2.4;3.6;3.6;4.1;4.7;5.3]; y- [33.8; 34.7:35. 5 ; 36 . O ; 37.5;38.1]; X[ones (size (x)) ,x]; build vector of x-values % build vector of y -values % build the matrix X for linear model % right hand side of the Normal Equations % Left hand side of the Normal Equations % Cholesky decomposition U-chol (S) % solve the normal equations using Cholesky decomposition plot (x, y, 'o) q2:0.1:6; fit-c (1) +c (2)q; hold on plot (q,fit,'r'); % plot the data points % define a vector for plotting the linear fit % define the linear fit % plot the linear fit together with the data points clf format short e dat = load ( gco2. dat' ) ; year dat (,1) conc- dat (:,2) X-[ones (size (x)), x,x.*2] U chol (S) hold on axis tight plot (q, fit, 'red', 'linewidth',2); hold off legend (' data points', 'linear fit', 'quadratic fit') (b) Find the best-fit quadratic polynomial to the CO2 data (make sure you change appropriately the matrix X). What are the coefficients c, c and c? Give the values with five digits of accuracy (use format short e). Plot the fitted curve in red (use 'linewidth' 2) together with the data points and the linear fit from part (a). Make sure you are plotting both lines and data points together on the same figure. Add a legend to the graph: legend ('data points', 'linear fit', 'quadratic fit', 'location', 'northwest) Error in LAB5 (line 8) X-[ones (size (x)),x, x.*2]; x[2.4;3.6;3.6;4.1;4.7;5.3]; y- [33.8; 34.7:35. 5 ; 36 . O ; 37.5;38.1]; X[ones (size (x)) ,x]; build vector of x-values % build vector of y -values % build the matrix X for linear model % right hand side of the Normal Equations % Left hand side of the Normal Equations % Cholesky decomposition U-chol (S) % solve the normal equations using Cholesky decomposition plot (x, y, 'o) q2:0.1:6; fit-c (1) +c (2)q; hold on plot (q,fit,'r'); % plot the data points % define a vector for plotting the linear fit % define the linear fit % plot the linear fit together with the data points clf format short e dat = load ( gco2. dat' ) ; year dat (,1) conc- dat (:,2) X-[ones (size (x)), x,x.*2] U chol (S) hold on axis tight plot (q, fit, 'red', 'linewidth',2); hold off legend (' data points', 'linear fit', 'quadratic fit') (b) Find the best-fit quadratic polynomial to the CO2 data (make sure you change appropriately the matrix X). What are the coefficients c, c and c? Give the values with five digits of accuracy (use format short e). Plot the fitted curve in red (use 'linewidth' 2) together with the data points and the linear fit from part (a). Make sure you are plotting both lines and data points together on the same figure. Add a legend to the graph: legend ('data points', 'linear fit', 'quadratic fit', 'location', 'northwest) Error in LAB5 (line 8) X-[ones (size (x)),x, x.*2]Step by Step Solution
There are 3 Steps involved in it
Step: 1

See step-by-step solutions with expert insights and AI powered tools for academic success
Step: 2

Step: 3

Ace Your Homework with AI
Get the answers you need in no time with our AI-driven, step-by-step assistance
Get Started


