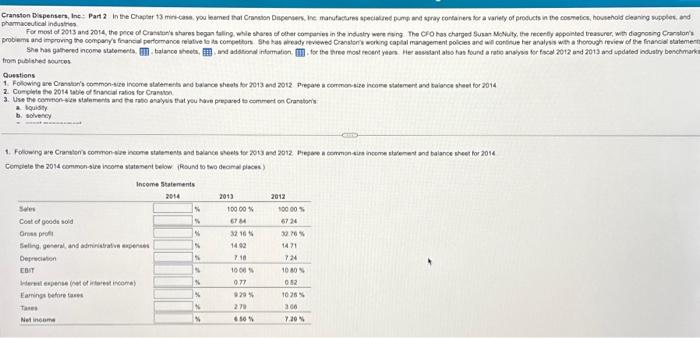
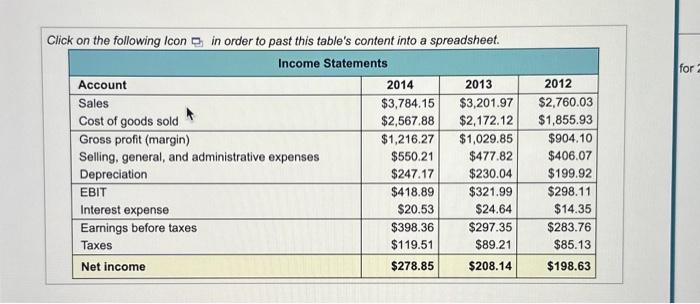
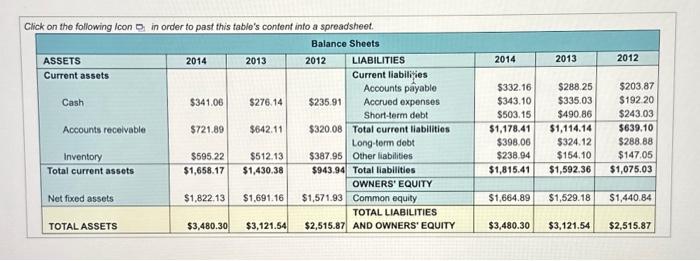
Click on the following Icon in order to past this table's content into a spreadsheet. \begin{tabular}{|l|r|r|r|} \hline \multicolumn{4}{|c|}{ Income Statements } \\ \hline Account & \multicolumn{1}{|c|}{2014} & \multicolumn{1}{|c|}{2013} & \multicolumn{1}{c|}{2012} \\ \hline Sales & $3,784.15 & $3,201.97 & $2,760.03 \\ Cost of goods sold & $2,567.88 & $2,172.12 & $1,855.93 \\ \hline Gross profit (margin) & $1,216.27 & $1,029.85 & $904.10 \\ Selling, general, and administrative expenses & $550.21 & $477.82 & $406.07 \\ Depreciation & $247.17 & $230.04 & $199.92 \\ \hline EBIT & $418.89 & $321.99 & $298.11 \\ Interest expense & $20.53 & $24.64 & $14.35 \\ \hline Earnings before taxes & $398.36 & $297.35 & $283.76 \\ Taxes & $119.51 & $89.21 & $85.13 \\ \hline Net income & $278.85 & $208.14 & $198.63 \\ \hline \end{tabular} phamaceutical industrits trom piblethed noutes Questions 2. Corplets the 2014 table of Enancial ratos for Cramaton a touisty. b. alivency Questions 1. Following are Cranston's common-size income statements and balance sheets for 2013 and 2012. Prepare a common-size income statement and balance sheet for 2014 . 2. Complete the 2014 table of firancial rasios for Cranston. 3. Use the common-size statements and the ratio analysis that you have prepared to comment on Cranston's: a. Equidity. b. solvency. c. asset management. d. profitability e. market performance. Indicate whether the ratios are improving or deteriorating over the three-year period and whether they are better or worso than the 2014 industry averages. 4. Express Cranston's ROE in terms of the DuPont identity. Which ratios are contributing to Cranston's below-average ROE? 5. Based on your analyses in Questions 1 through 4 , why do you think Cranston's recent stock performance has been disappointing? Click on the following Icon \begin{tabular}{|l|r|r|r|} \hline & 2014 & \multicolumn{1}{|c|}{2013} & \multicolumn{1}{|c|}{2012} \\ \hline Stock price per share & $33.12 & $37.95 & $32.06 \\ \hline Dividend per share & $1.05 & $0.88 & $0.68 \\ \hline Shares outstanding (millions) & 143.2 & 143.2 & 143.2 \\ \hline \end{tabular} Click on the following Icon in order to past this table's content into a spreadsheet. \begin{tabular}{|l|r|r|r|} \hline \multicolumn{4}{|c|}{ Income Statements } \\ \hline Account & \multicolumn{1}{|c|}{2014} & \multicolumn{1}{|c|}{2013} & \multicolumn{1}{c|}{2012} \\ \hline Sales & $3,784.15 & $3,201.97 & $2,760.03 \\ Cost of goods sold & $2,567.88 & $2,172.12 & $1,855.93 \\ \hline Gross profit (margin) & $1,216.27 & $1,029.85 & $904.10 \\ Selling, general, and administrative expenses & $550.21 & $477.82 & $406.07 \\ Depreciation & $247.17 & $230.04 & $199.92 \\ \hline EBIT & $418.89 & $321.99 & $298.11 \\ Interest expense & $20.53 & $24.64 & $14.35 \\ \hline Earnings before taxes & $398.36 & $297.35 & $283.76 \\ Taxes & $119.51 & $89.21 & $85.13 \\ \hline Net income & $278.85 & $208.14 & $198.63 \\ \hline \end{tabular} phamaceutical industrits trom piblethed noutes Questions 2. Corplets the 2014 table of Enancial ratos for Cramaton a touisty. b. alivency Questions 1. Following are Cranston's common-size income statements and balance sheets for 2013 and 2012. Prepare a common-size income statement and balance sheet for 2014 . 2. Complete the 2014 table of firancial rasios for Cranston. 3. Use the common-size statements and the ratio analysis that you have prepared to comment on Cranston's: a. Equidity. b. solvency. c. asset management. d. profitability e. market performance. Indicate whether the ratios are improving or deteriorating over the three-year period and whether they are better or worso than the 2014 industry averages. 4. Express Cranston's ROE in terms of the DuPont identity. Which ratios are contributing to Cranston's below-average ROE? 5. Based on your analyses in Questions 1 through 4 , why do you think Cranston's recent stock performance has been disappointing? Click on the following Icon \begin{tabular}{|l|r|r|r|} \hline & 2014 & \multicolumn{1}{|c|}{2013} & \multicolumn{1}{|c|}{2012} \\ \hline Stock price per share & $33.12 & $37.95 & $32.06 \\ \hline Dividend per share & $1.05 & $0.88 & $0.68 \\ \hline Shares outstanding (millions) & 143.2 & 143.2 & 143.2 \\ \hline \end{tabular}


