Question
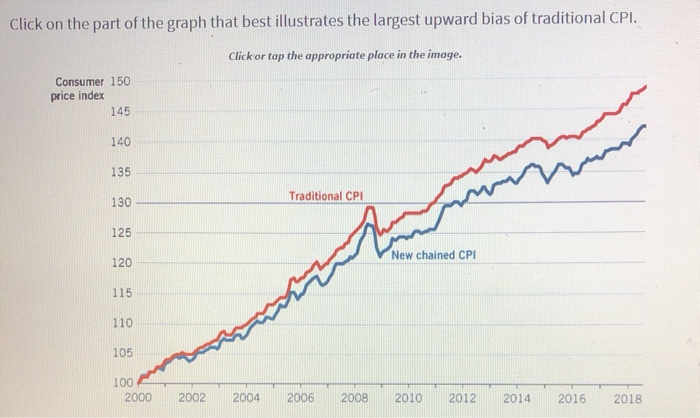
Click on the part of the graph that best illustrates the largest upward bias of traditional CPI. Click or tap the appropriate place in

Click on the part of the graph that best illustrates the largest upward bias of traditional CPI. Click or tap the appropriate place in the image. Consumer 150 price index 145 140 135 130 125 120 115 110 105 100 2000 2002 2004 Traditional CPI New chained CPI 2006 2008 2010 2012 2014 v 2016 2018
Step by Step Solution
3.52 Rating (155 Votes )
There are 3 Steps involved in it
Step: 1
When an estimate is upwardly biased it is calculated at a higher ...
Get Instant Access to Expert-Tailored Solutions
See step-by-step solutions with expert insights and AI powered tools for academic success
Step: 2

Step: 3

Ace Your Homework with AI
Get the answers you need in no time with our AI-driven, step-by-step assistance
Get StartedRecommended Textbook for
Management Accounting Information for Decision-Making and Strategy Execution
Authors: Anthony A. Atkinson, Robert S. Kaplan, Ella Mae Matsumura, S. Mark Young
6th Edition
137024975, 978-0137024971
Students also viewed these Economics questions
Question
Answered: 1 week ago
Question
Answered: 1 week ago
Question
Answered: 1 week ago
Question
Answered: 1 week ago
Question
Answered: 1 week ago
Question
Answered: 1 week ago
Question
Answered: 1 week ago
Question
Answered: 1 week ago
Question
Answered: 1 week ago
Question
Answered: 1 week ago
Question
Answered: 1 week ago
Question
Answered: 1 week ago
Question
Answered: 1 week ago
Question
Answered: 1 week ago
Question
Answered: 1 week ago
Question
Answered: 1 week ago
Question
Answered: 1 week ago
Question
Answered: 1 week ago
Question
Answered: 1 week ago
Question
Answered: 1 week ago
Question
Answered: 1 week ago
Question
Answered: 1 week ago
View Answer in SolutionInn App


