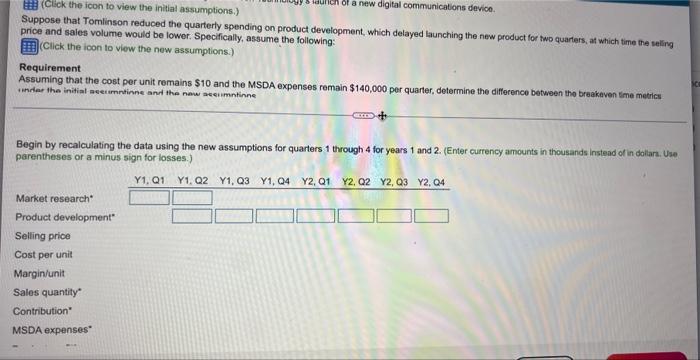
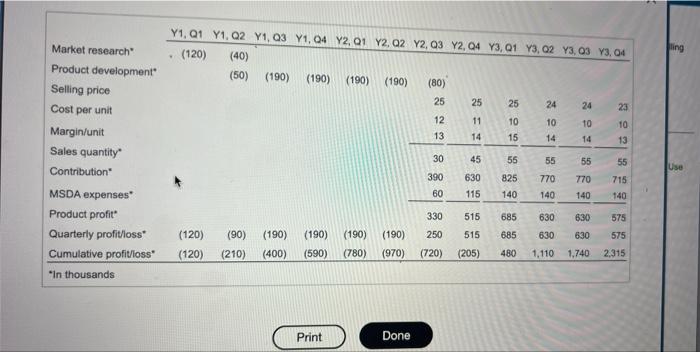
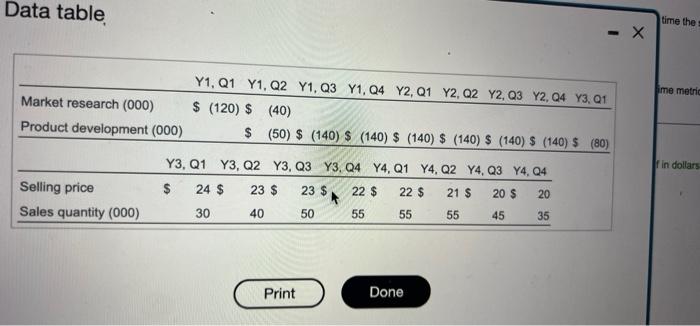
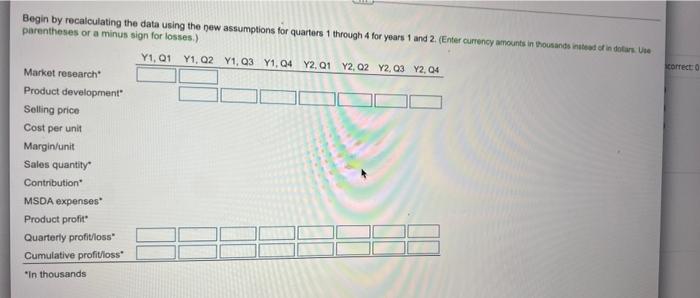
(Click the icon to view the initial assumptions.) launch of a new digital communications device. Suppose that Tomlinson reduced the quarterly spending on product development, which delayed launching the new product for two quarters, at which time the selling price and sales volume would be lower. Specifically, assume the following: (Click the icon to view the new assumptions.) Requirement Assuming that the cost per unit remains $10 and the MSDA expenses remain $140,000 per quarter, determine the difference between the breakeven time metrics under the initial accumntinne and the new accumntinne Begin by recalculating the data using the new assumptions for quarters 1 through 4 for years 1 and 2. (Enter currency amounts in thousands instead of in dollars. Use parentheses or a minus sign for losses.) Y1, Q1 Y1, Q2 Y1, Q3 Y1, Q4 Y2, Q1 Y2, Q2 Y2,Q3 Y2, Q4 Market research" Product development" Selling price Cost per unit Margin/unit Sales quantity" Contribution" MSDA expenses* Market research" Product development" Selling price Cost per unit Margin/unit Sales quantity* Contribution MSDA expenses Product profit Quarterly profit/loss Cumulative profit/loss "In thousands Y1, Q1 Y1, Q2 Y1, 03 Y1, 04 Y2, Q1 Y2. 02 Y2, Q3 Y2, Q4 Y3, Q1 Y3, 02 Y3, 03 Y3, 04 (120) (40) (50) (190) (190) (190) (190) (80) 25 25 25 24 24 23 12 11 10 10 10 10 13 14 15 14 14 13 30 45 55 55 55 55 390 630 825 770 770 715 60 115 140 140 140 140 330 630 630 575 (190) (190) (190) 250 515 515 685 685 480 1,110 1,740 2,315 (120) (90) (190) 630 630 575 (120) (210) (400) (590) (780) (970) (720) (205) Print Done ing Use Data table X Y1, Q1 Y1, Q2 Y1, Q3 Y1, Q4 Y2, Q1 Y2, Q2 Y2, Q3 Y2, Q4 Y3, Q1 $ (120) $ (40) $ (50) $ (140) $ (140) $ (140) $ (140) $ (140) S (140) $ (80) Y3, Q1 Y3, Q2 Y3, Q3 Y3, Q4 Y4, Q1 Y4, Q2 Y4, Q3 Y4, Q4 $ 24 $ 23 $ 23 $ 22 $ 22 $ 21 $ 20 $ 20 30 40 50 55 55 55 45 35 Market research (000) Product development (000) Selling price Sales quantity (000) Print Done time the ime metric f in dollars Begin by recalculating the data using the new assumptions for quarters 1 through 4 for years 1 and 2. (Enter currency amounts in thousands instead of in dollars. Use parentheses or a minus sign for losses.) Y1, Q1 Y1, Q2 Y1, 03 Y1,04 Y2.01 Y2, 02 Y2,03 2,04 correct: 0 Market research Product development" Selling price Cost per unit Margin/unit Sales quantity Contribution MSDA expenses" Product profit Quarterly profit/loss" Cumulative profit/loss "In thousands (Click the icon to view the initial assumptions.) launch of a new digital communications device. Suppose that Tomlinson reduced the quarterly spending on product development, which delayed launching the new product for two quarters, at which time the selling price and sales volume would be lower. Specifically, assume the following: (Click the icon to view the new assumptions.) Requirement Assuming that the cost per unit remains $10 and the MSDA expenses remain $140,000 per quarter, determine the difference between the breakeven time metrics under the initial accumntinne and the new accumntinne Begin by recalculating the data using the new assumptions for quarters 1 through 4 for years 1 and 2. (Enter currency amounts in thousands instead of in dollars. Use parentheses or a minus sign for losses.) Y1, Q1 Y1, Q2 Y1, Q3 Y1, Q4 Y2, Q1 Y2, Q2 Y2,Q3 Y2, Q4 Market research" Product development" Selling price Cost per unit Margin/unit Sales quantity" Contribution" MSDA expenses* Market research" Product development" Selling price Cost per unit Margin/unit Sales quantity* Contribution MSDA expenses Product profit Quarterly profit/loss Cumulative profit/loss "In thousands Y1, Q1 Y1, Q2 Y1, 03 Y1, 04 Y2, Q1 Y2. 02 Y2, Q3 Y2, Q4 Y3, Q1 Y3, 02 Y3, 03 Y3, 04 (120) (40) (50) (190) (190) (190) (190) (80) 25 25 25 24 24 23 12 11 10 10 10 10 13 14 15 14 14 13 30 45 55 55 55 55 390 630 825 770 770 715 60 115 140 140 140 140 330 630 630 575 (190) (190) (190) 250 515 515 685 685 480 1,110 1,740 2,315 (120) (90) (190) 630 630 575 (120) (210) (400) (590) (780) (970) (720) (205) Print Done ing Use Data table X Y1, Q1 Y1, Q2 Y1, Q3 Y1, Q4 Y2, Q1 Y2, Q2 Y2, Q3 Y2, Q4 Y3, Q1 $ (120) $ (40) $ (50) $ (140) $ (140) $ (140) $ (140) $ (140) S (140) $ (80) Y3, Q1 Y3, Q2 Y3, Q3 Y3, Q4 Y4, Q1 Y4, Q2 Y4, Q3 Y4, Q4 $ 24 $ 23 $ 23 $ 22 $ 22 $ 21 $ 20 $ 20 30 40 50 55 55 55 45 35 Market research (000) Product development (000) Selling price Sales quantity (000) Print Done time the ime metric f in dollars Begin by recalculating the data using the new assumptions for quarters 1 through 4 for years 1 and 2. (Enter currency amounts in thousands instead of in dollars. Use parentheses or a minus sign for losses.) Y1, Q1 Y1, Q2 Y1, 03 Y1,04 Y2.01 Y2, 02 Y2,03 2,04 correct: 0 Market research Product development" Selling price Cost per unit Margin/unit Sales quantity Contribution MSDA expenses" Product profit Quarterly profit/loss" Cumulative profit/loss "In thousands