

Answered step by step
Verified Expert Solution
Question
1 Approved Answer
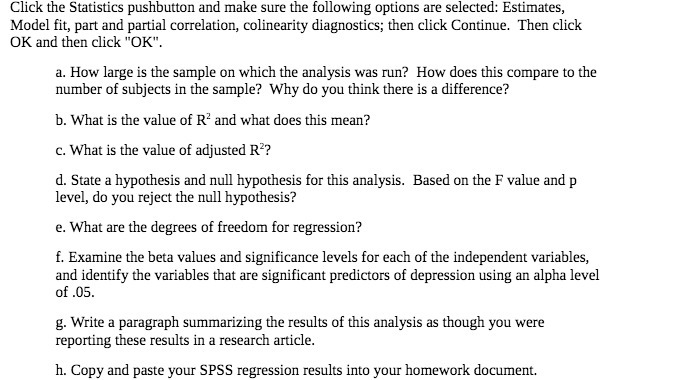
Click the Statistics pushhutton and make sure the following options are selected: Estimates, Model fit, part and partial correlation. colinearity diagnostics; then click Continue. Then
Step by Step Solution
There are 3 Steps involved in it
Step: 1

Get Instant Access to Expert-Tailored Solutions
See step-by-step solutions with expert insights and AI powered tools for academic success
Step: 2

Step: 3
Ace Your Homework with AI
Get the answers you need in no time with our AI-driven, step-by-step assistance
Get Started
An Introduction to the Mathematics of financial Derivatives
Authors: Salih N. Neftci
2nd Edition
978-0125153928, 9780080478647, 125153929, 978-0123846822