

Question
Cloud commputing. Read the case study and Summarize whats going on with Figures 8.8, 8.9, 8.10, 8.11. Figure 8.8. At timestamp = t1, a firewall
Cloud commputing.
Read the case study and Summarize whats going on with Figures 8.8, 8.9, 8.10, 8.11.
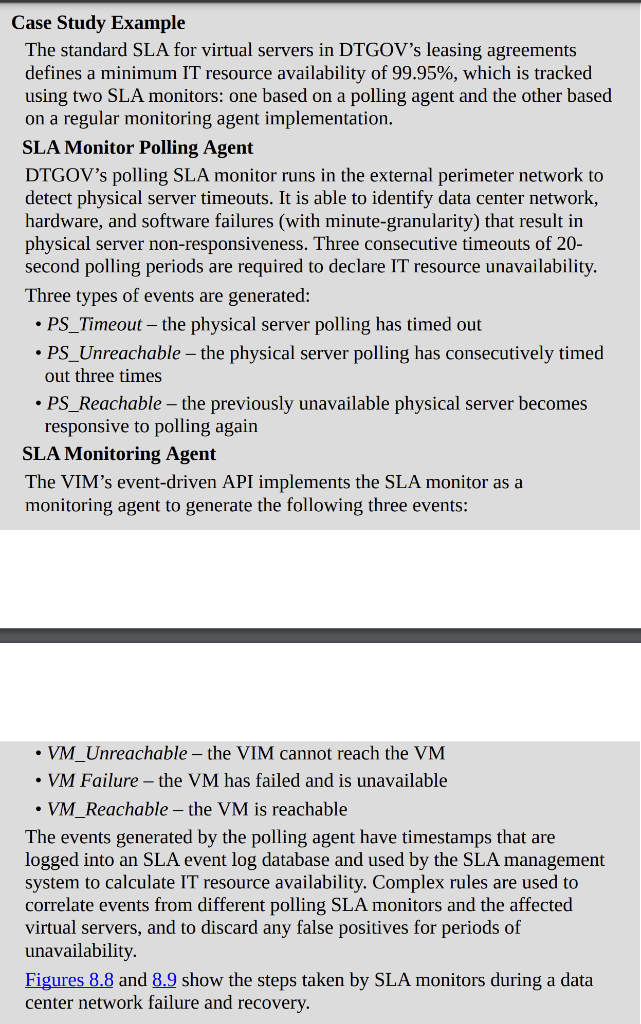
Figure 8.8. At timestamp = t1, a firewall cluster has failed and all of the IT resources in the data center become unavailable (1). The SLA monitor polling agent stops receiving responses from physical servers and starts to issue PS_timeout events (2). The SLA monitor polling agent starts issuing PS_unreachable events after three successive PS_timeout events. The timestamp is now t2 (3).
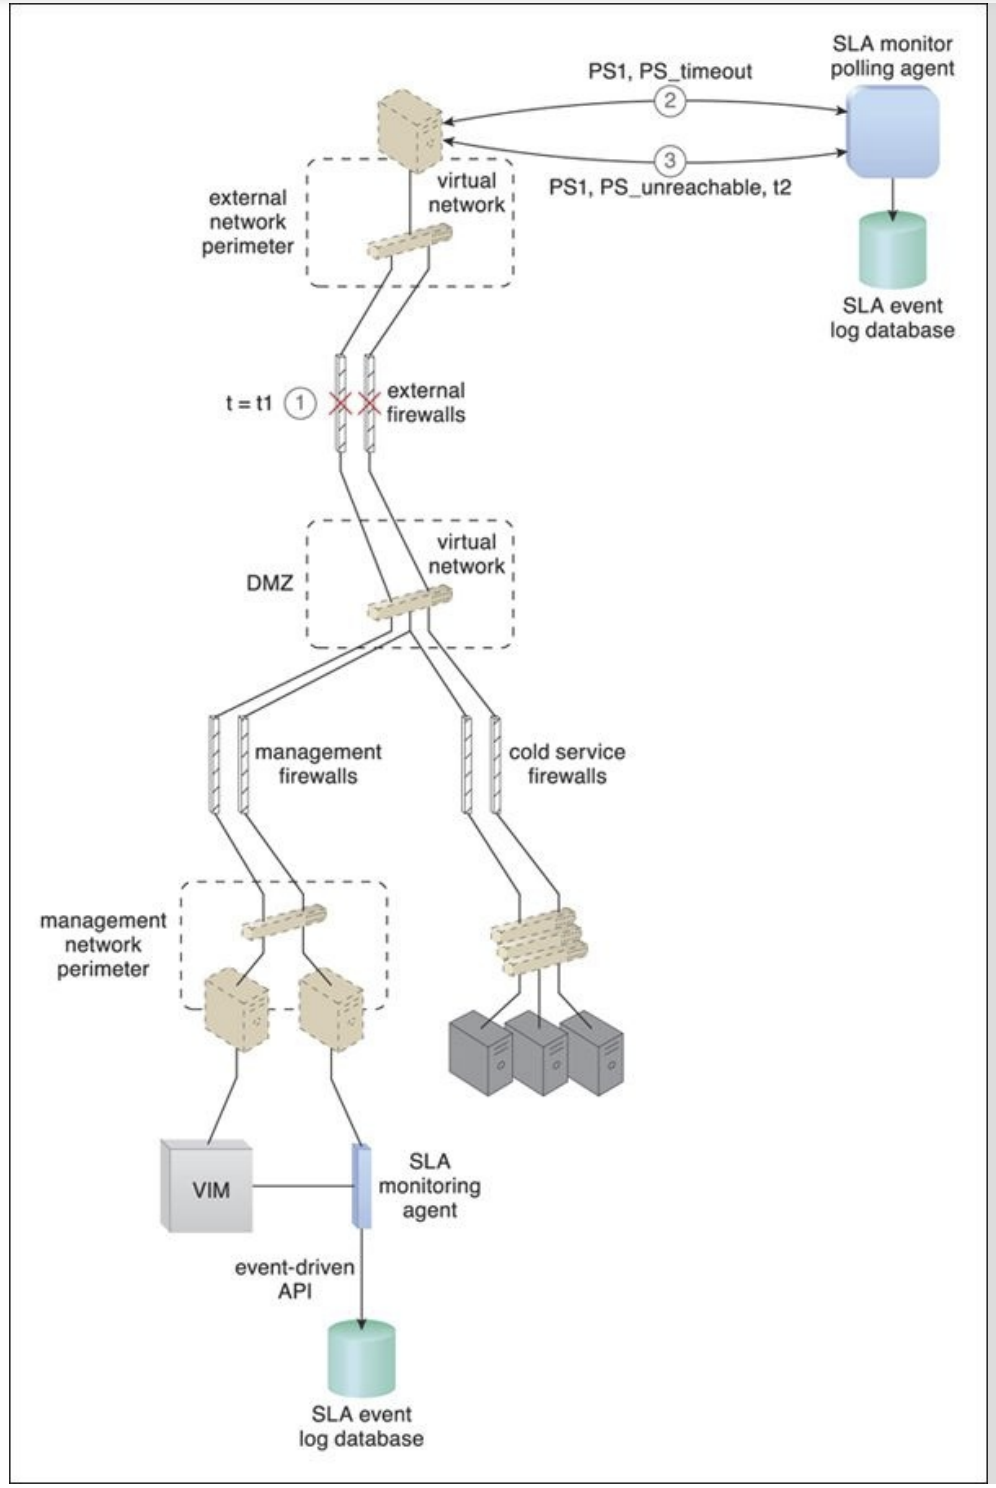
Figure 8.9. The IT resource becomes operational at timestamp = t3 (4). The SLA monitor polling agent receives responses from the physical servers and issues PS_reachable events. The timestamp is now t4 (5). The SLA monitoring agent did not detect any unavailability since the communication between the VIM platform and physical servers was not affected by the failure (6). The SLA management system uses the information stored in the log database to calculate the period of unavailability as t4 t3, which affected all of the virtual servers in the data center. Figures 8.10 and 8.11 illustrate the steps that are taken by the SLA monitors during the failure and subsequent recovery of a physical server that is hosting three virtual servers (VM1, VM2, VM3).
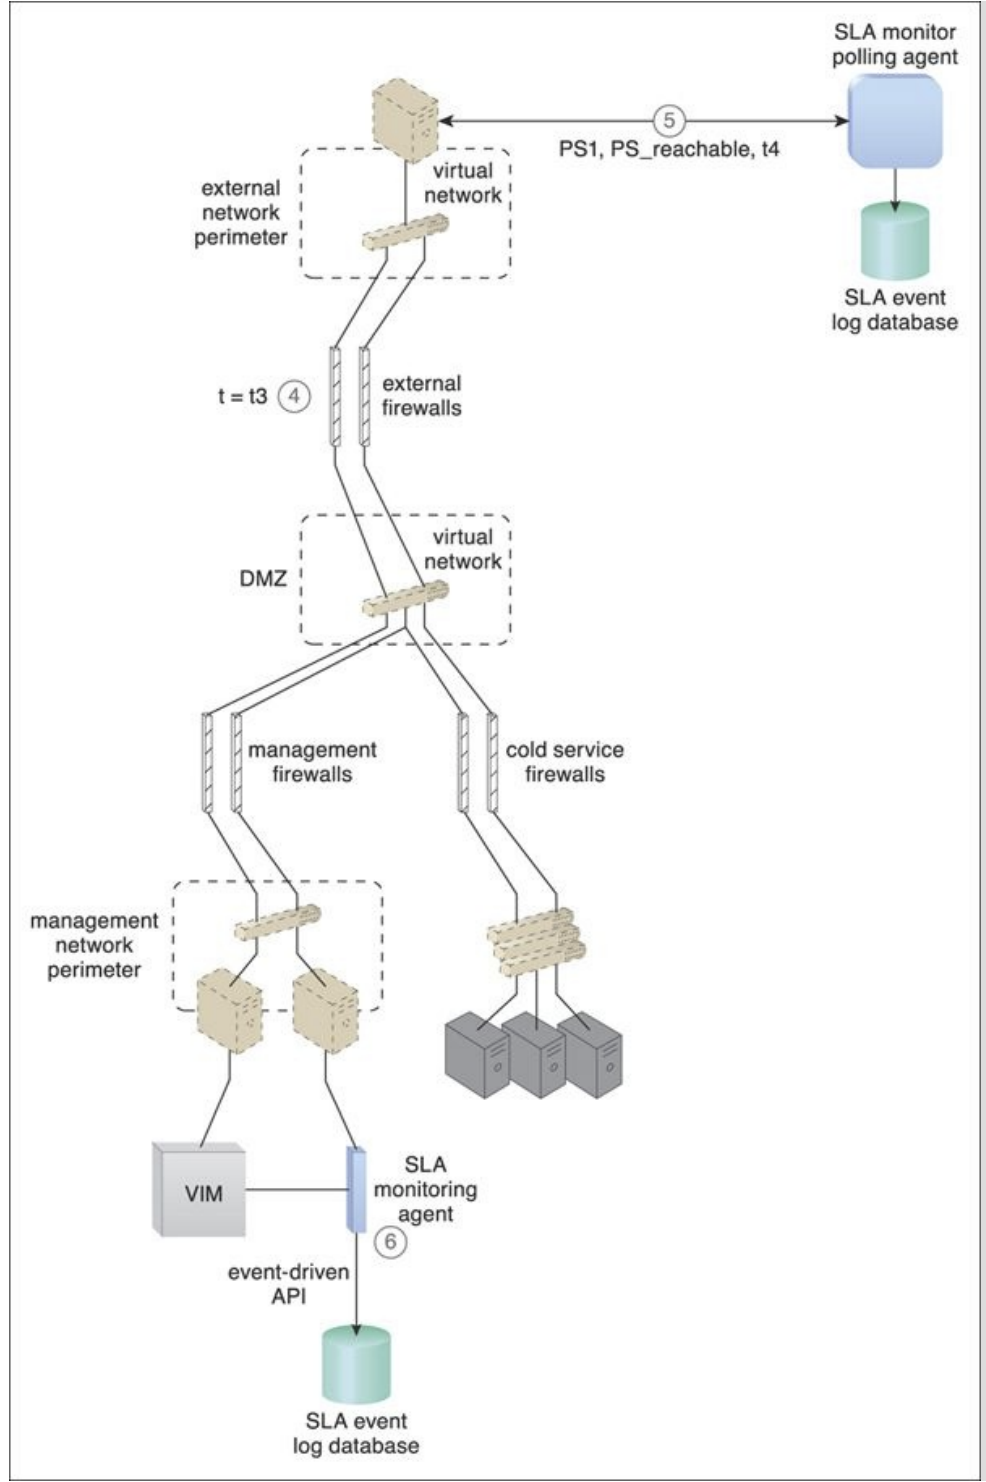
Figure 8.10. At timestamp = t1, the physical host server has failed and becomes unavailable (1). The SLA monitoring agent captures a VM_unreachable event that is generated for each virtual server in the failed host server (2a). The SLA monitor polling agent stops receiving responses from the host server and issues PS_timeout events (2b). At timestamp = t2, the SLA monitoring agent captures a VM_failure event that is generated for each of the failed host servers three virtual servers (3a). The SLA monitor polling agent starts to issue PS_unavailable events after three successive PS_timeout events at timestamp = t3 (3b).
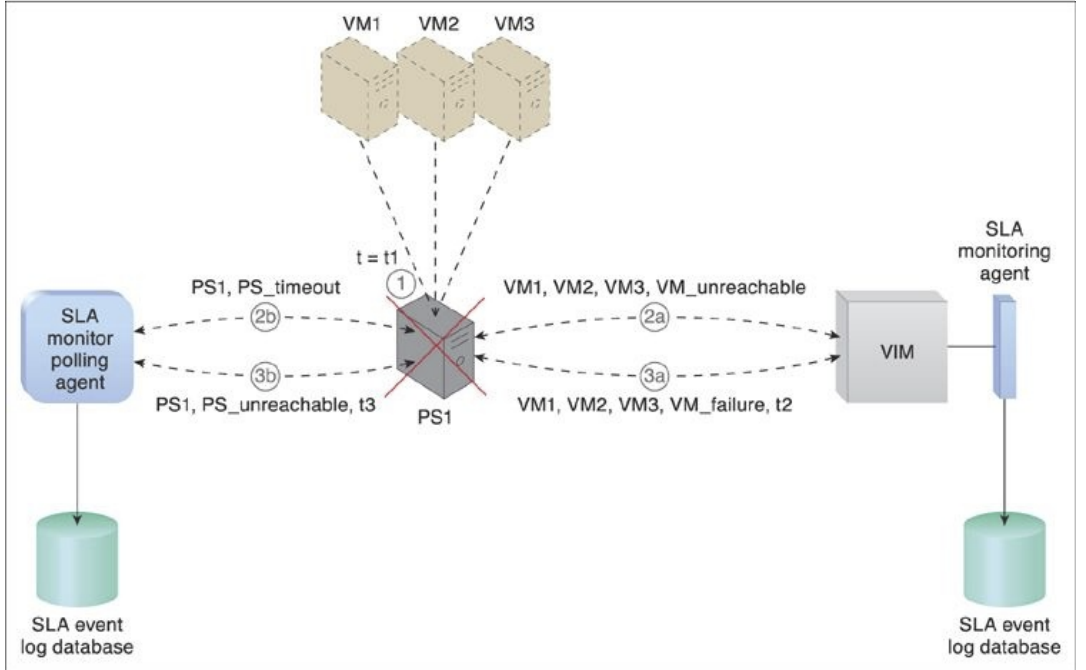
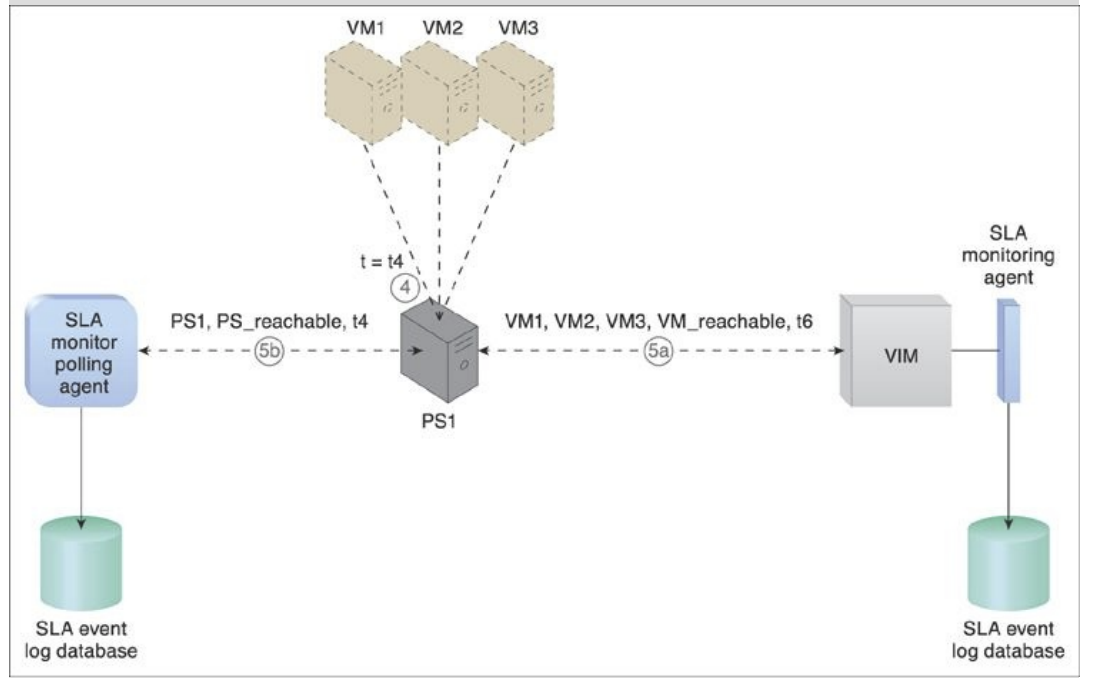
Figure 8.11. The host server becomes operational at timestamp = t4 (4). The SLA monitor polling agent receives responses from the physical server and issues PS_reachable events at timestamp = t5 (5a). At timestamp = t6, the SLA monitoring agent captures a VM_reachable event that is generated for each virtual server (5b). The SLA management system calculates the unavailability period that affected all of the virtual servers as t6 t2
Read the case study and Summarize whats going on with Figures 8.8, 8.9, 8.10, 8.11.
Case Study Example The standard SLA for virtual servers in DTGOV's leasing agreements defines a minimum IT resource availability of 99.95%, which is tracked using two SLA monitors: one based on a polling agent and the other based on a regular monitoring agent implementation. SLA Monitor Polling Agent DTGOV's polling SLA monitor runs in the external perimeter network to detect physical server timeouts. It is able to identify data center network, hardware, and software failures (with minute-granularity) that result in physical server non-responsiveness. Three consecutive timeouts of 20- second polling periods are required to declare IT resource unavailability. Three types of events are generated: PS_Timeout the physical server polling has timed out PS_Unreachable the physical server polling has consecutively timed out three times PS_Reachable the previously unavailable physical server becomes responsive to polling again SLA Monitoring Agent The VIM's event-driven API implements the SLA monitor as a monitoring agent to generate the following three events: VM_Unreachable the VIM cannot reach the VM VM Failure the VM has failed and is unavailable VM_Reachable the VM is reachable The events generated by the polling agent have timestamps that are logged into an SLA event log database and used by the SLA management system to calculate IT resource availability. Complex rules are used to correlate events from different polling SLA monitors and the affected virtual servers, and to discard any false positives for periods of unavailability. Figures 8.8 and 8.9 show the steps taken by SLA monitors during a data center network failure and recovery. SLA monitor polling agent PS1, PS_timeout virtual network PS1, PS_unreachable, t2 external network perimeter SLA event log database t = t1 OX external firewalls virtual network DMZ management firewalls cold service firewalls management network perimeter VIM SLA monitoring agent event-driven API SLA event log database SLA monitor polling agent PS1, PS_reachable, 14 virtual network external network perimeter SLA event log database t = t3 (4 external firewalls virtual network DMZ management firewalls cold service firewalls management network perimeter VIM SLA monitoring agent event-driven API SLA event log database VM1 VM2 VM3 SLA monitoring agent PS1, PS_timeout 25 VM1, VM2, VM3, VM_unreachable SLA monitor polling agent VIM 3b PS1, PS_unreachable, t3 PS1 VM1, VM2, VM3, VM_failure, t2 SLA event log database SLA event log database VM1 VM2 VM3 SLA monitoring agent PS1, PS_reachable, t4 VM1, VM2, VM3, VM_reachable, t6 SLA monitor polling agent VIM PS1 SLA event log database SLA event log databaseStep by Step Solution
There are 3 Steps involved in it
Step: 1

Get Instant Access to Expert-Tailored Solutions
See step-by-step solutions with expert insights and AI powered tools for academic success
Step: 2

Step: 3
Ace Your Homework with AI
Get the answers you need in no time with our AI-driven, step-by-step assistance
Get Started
DATABASE Administrator Make A Difference
Authors: Mohciine Elmourabit
1st Edition
B0CGM7XG75, 978-1722657802