Answered step by step
Verified Expert Solution
Question
1 Approved Answer
Coca-cola Revenues ($ millions), 2005-2010 Quarter 2005 2906 2007 2008 2009 2010 Qtr1 5, 204 5,126 6,085 7,490 7,170 8,090 Otr 2 6,308 6,475 7,715
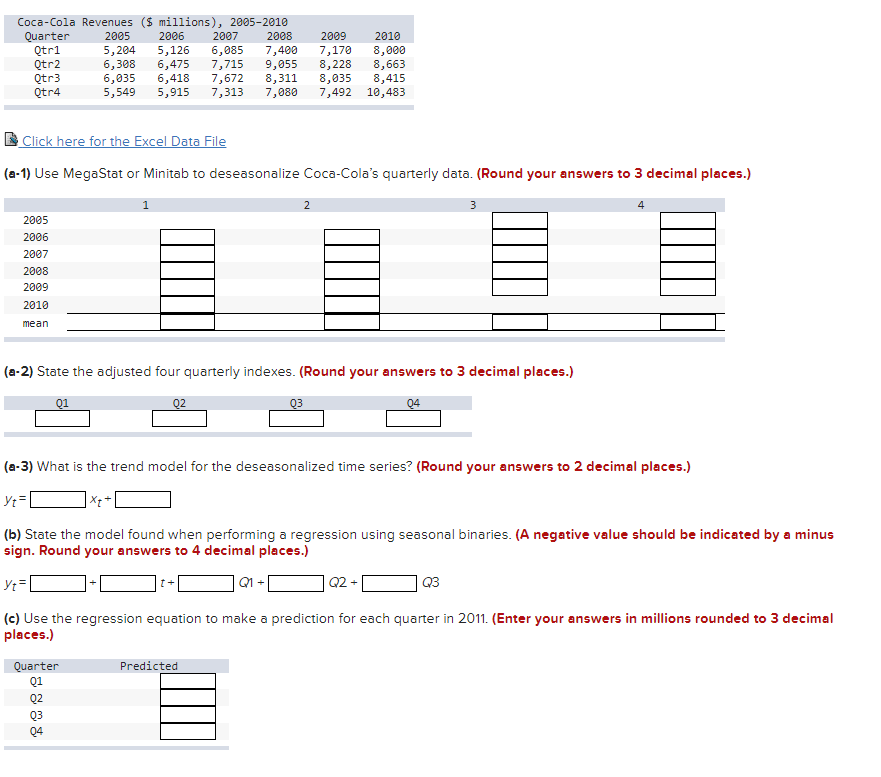
Coca-cola Revenues ($ millions), 2005-2010 Quarter 2005 2906 2007 2008 2009 2010 Qtr1 5, 204 5,126 6,085 7,490 7,170 8,090 Otr 2 6,308 6,475 7,715 9,055 8, 228 8,663 Qtr3 6,035 6,418 7,672 8,311 8,035 8,415 Qtr4 5,549 5,915 7,313 7,080 7,492 10,483 Click here for the Excel Data File (a-1) Use MegaStat or Minitab to deseasonalize Coca-Cola's quarterly data. (Round your answers to 3 decimal places.) 2005 2006 2007 2008 2009 2010 mean (a-2) State the adjusted four quarterly indexes. (Round your answers to 3 decimal places.) Q1 Q2 Q3 04 (a-3) What is the trend model for the deseasonalized time series? (Round your answers to 2 decimal places.) It = [ (b) State the model found when performing a regression using seasonal binaries. (A negative value should be indicated by a minus sign. Round your answers to 4 decimal places.) Vt = [ 101 +0 1Q2 +1 Q3 (c) Use the regression equation to make a prediction for each quarter in 2011. (Enter your answers in millions rounded to 3 decimal places.) Quarter Predicted Q1 Q2 Q3 04
Step by Step Solution
There are 3 Steps involved in it
Step: 1
Get Instant Access to Expert-Tailored Solutions
See step-by-step solutions with expert insights and AI powered tools for academic success
Step: 2
Step: 3
Ace Your Homework with AI
Get the answers you need in no time with our AI-driven, step-by-step assistance
Get Started