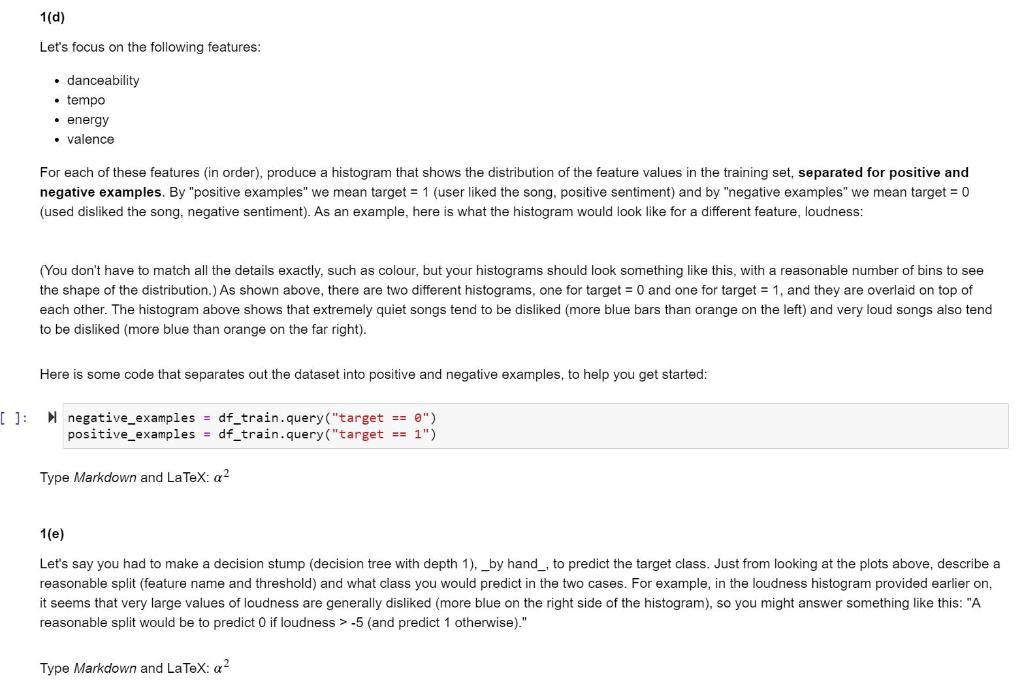
Code the following question in Python:


1(d) Let's focus on the following features: danceability tempo energy valence For each of these features in order), produce a histogram that shows the distribution of the feature values in the training set, separated for positive and negative examples. By "positive examples" we mean target = 1 (user liked the song, positive sentiment) and by "negative examples" we mean target = 0 (used disliked the song, negative sentiment). As an example, here is what the histogram would look like for a different feature, loudness: (You don't have to match all the details exactly, such as colour, but your histograms should look something like this, with a reasonable number of bins to see the shape of the distribution.) As shown above, there are two different histograms, one for target = 0 and one for target = 1, and they are overlaid on top of each other. The histogram above shows that extremely quiet songs tend to be disliked (more blue bars than orange on the left) and very loud songs also tend to be disliked (more blue than orange on the far right). Here is some code that separates out the dataset into positive and negative examples, to help you get started: [ ]: negative_examples = df_train.query("target == 0") positive_examples = df_train.query("target == 1") Type Markdown and LaTeX: a2 1(e) Let's say you had to make a decision stump (decision tree with depth 1), _by hand_, to predict the target class. Just from looking at the plots above, describe a reasonable split (feature name and threshold) and what class you would predict in the two cases. For example, in the loudness histogram provided earlier on, it seems that very large values of loudness are generally disliked (more blue on the right side of the histogram), so you might answer something like this: "A reasonable split would be to predict O if loudness > -5 (and predict 1 otherwise)" Type Markdown and LaTeX: a2 1(f) Let's say that, for a particular feature, the histograms of that feature are identical for the two target classes. Does that mean the feature is not useful for predicting the target class? 1(g) Note that the dataset includes two free text features labeled song_title and artist : In [ ]: Ndf_train[["song_title", "artist"]].head() Do you think these features could be useful in predicting whether the user liked the song or not? Would there be any difficulty in using them in your model? Type Markdown and LaTeX: a2 1(d) Let's focus on the following features: danceability tempo energy valence For each of these features in order), produce a histogram that shows the distribution of the feature values in the training set, separated for positive and negative examples. By "positive examples" we mean target = 1 (user liked the song, positive sentiment) and by "negative examples" we mean target = 0 (used disliked the song, negative sentiment). As an example, here is what the histogram would look like for a different feature, loudness: (You don't have to match all the details exactly, such as colour, but your histograms should look something like this, with a reasonable number of bins to see the shape of the distribution.) As shown above, there are two different histograms, one for target = 0 and one for target = 1, and they are overlaid on top of each other. The histogram above shows that extremely quiet songs tend to be disliked (more blue bars than orange on the left) and very loud songs also tend to be disliked (more blue than orange on the far right). Here is some code that separates out the dataset into positive and negative examples, to help you get started: [ ]: negative_examples = df_train.query("target == 0") positive_examples = df_train.query("target == 1") Type Markdown and LaTeX: a2 1(e) Let's say you had to make a decision stump (decision tree with depth 1), _by hand_, to predict the target class. Just from looking at the plots above, describe a reasonable split (feature name and threshold) and what class you would predict in the two cases. For example, in the loudness histogram provided earlier on, it seems that very large values of loudness are generally disliked (more blue on the right side of the histogram), so you might answer something like this: "A reasonable split would be to predict O if loudness > -5 (and predict 1 otherwise)" Type Markdown and LaTeX: a2 1(f) Let's say that, for a particular feature, the histograms of that feature are identical for the two target classes. Does that mean the feature is not useful for predicting the target class? 1(g) Note that the dataset includes two free text features labeled song_title and artist : In [ ]: Ndf_train[["song_title", "artist"]].head() Do you think these features could be useful in predicting whether the user liked the song or not? Would there be any difficulty in using them in your model? Type Markdown and LaTeX: a2


