

Answered step by step
Verified Expert Solution
Question
1 Approved Answer
Code this usimg C language and comment on each sections for understanding the code Program 7 (Simple Raster-Scan Graphics) Source and header files http://mjgeiger.github.io/eece2160/programs/src/prog7_raster.c http://mjgeiger.github.io/eece2160/programs/src/prog7_functions.c
Code this usimg C language and comment on each sections for understanding the code 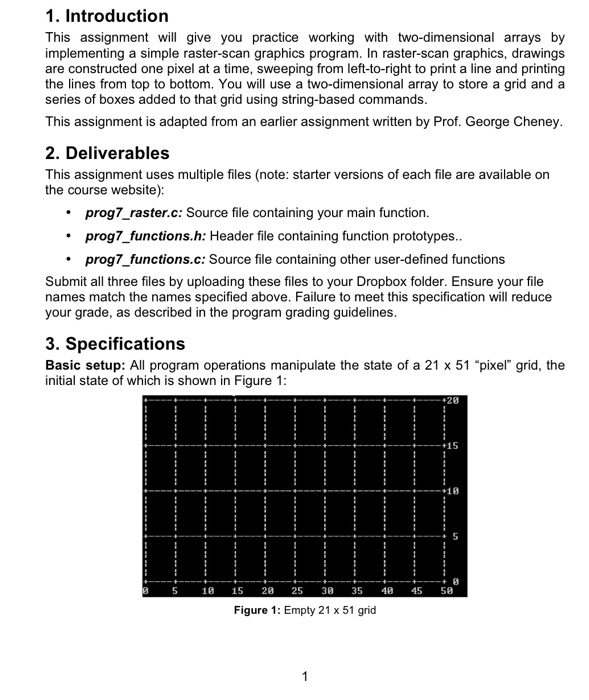
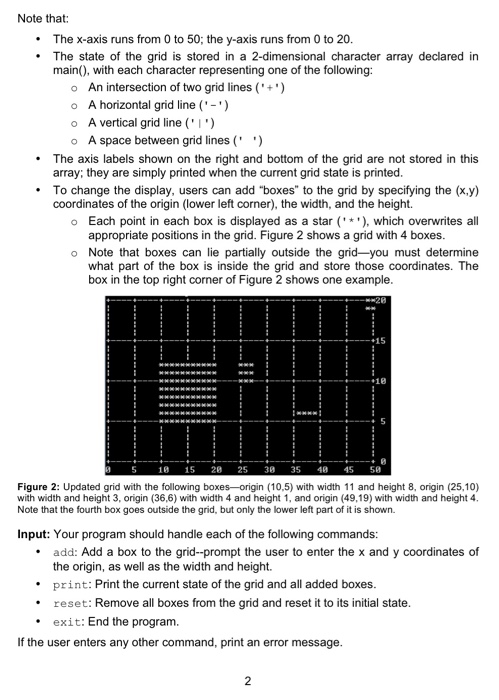
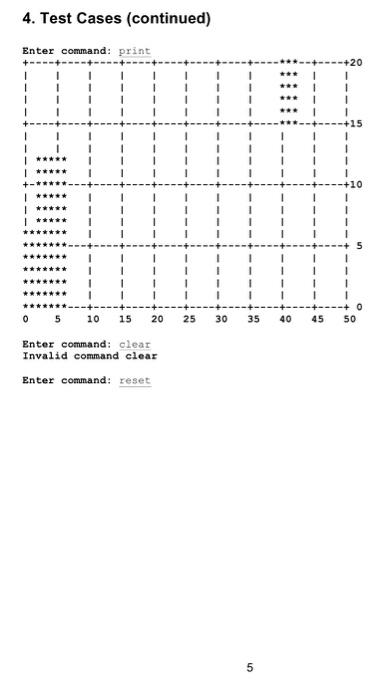
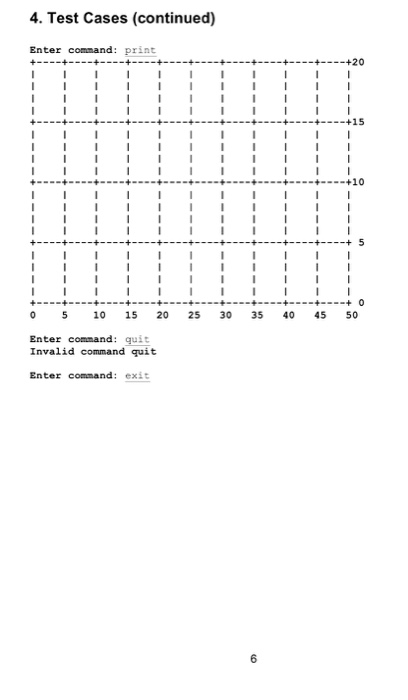
1. Introduction This assignment will give you practice working with two-dimensional arrays by implementing a simple raster-scan graphics program. In raster-scan graphics, drawings are constructed one pixel at a time, sweeping from left-to-right to print a line and printing the lines from top to bottom. You will use a two-dimensional array to store a grid and a series of boxes added to that grid using string-based commands. This assignment is adapted from an earlier assignment written by Prof. George Cheney. 2. Deliverables This assignment uses multiple files (note: starter versions of each file are available on the course website): prog7_raster.c: Source file containing your main function. prog7_functions.h: Header file containing function prototypes.. prog7_functions.c: Source file containing other user-defined functions Submit all three files by uploading these files to your Dropbox folder. Ensure your file names match the names specified above. Failure to meet this specification will reduce your grade, as described in the program grading guidelines. 3. Specifications Basic setup: All program operations manipulate the state of a 21 x 51 "pixel" grid, the initial state of which is shown in Figure 1: 15 10 + 0 0 5 10 15 2 25 30 35 45 50 Figure 1: Empty 21 x 51 grid Program 7 (Simple Raster-Scan Graphics)
Source and header files
http://mjgeiger.github.io/eece2160/programs/src/prog7_raster.c
http://mjgeiger.github.io/eece2160/programs/src/prog7_functions.c
http://mjgeiger.github.io/eece2160/programs/src/prog7_functions.h
Step by Step Solution
There are 3 Steps involved in it
Step: 1

Get Instant Access to Expert-Tailored Solutions
See step-by-step solutions with expert insights and AI powered tools for academic success
Step: 2

Step: 3
Ace Your Homework with AI
Get the answers you need in no time with our AI-driven, step-by-step assistance
Get Started
Optimizing Data Collection In Warzones
Authors: Aaget Aamber
1st Edition
B0CQRRFP5F, 979-8869065902