

Answered step by step
Verified Expert Solution
Question
1 Approved Answer
Coding Challenge: Dynamic Data Visualization Dashboard Objective: Create a dynamic data visualization dashboard using D 3 . js that displays stock values from a CSV
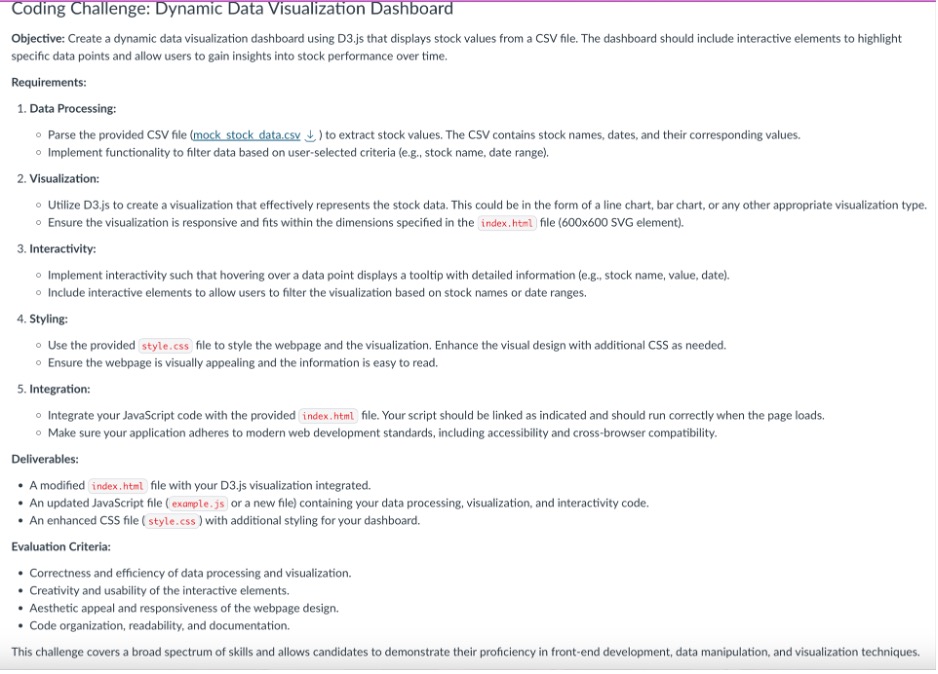
Coding Challenge: Dynamic Data Visualization Dashboard
Objective: Create a dynamic data visualization dashboard using Djs that displays stock values from a CSV file. The dashboard should include interactive elements to highlight
specific data points and allow users to gain insights into stock performance over time.
Requirements:
Data Processing:
Parse the provided CSV file mock stock data.csV darr to extract stock values. The CSV contains stock names, dates, and their corresponding values.
Implement functionality to filter data based on userselected criteria eg stock name, date range
Visualization:
Utilize Djs to create a visualization that effectively represents the stock data. This could be in the form of a line chart, bar chart, or any other appropriate visualization type.
Ensure the visualization is responsive and fits within the dimensions specified in the index. html file SVG element
Interactivity:
Implement interactivity such that hovering over a data point displays a tooltip with detailed information eg stock name, value, date
Include interactive elements to allow users to filter the visualization based on stock names or date ranges.
Styling:
Use the provided style.css file to style the webpage and the visualization. Enhance the visual design with additional CSS as needed.
Ensure the webpage is visually appealing and the information is easy to read.
Integration:
Integrate your JavaScript code with the provided index. html file. Your script should be linked as indicated and should run correctly when the page loads.
Make sure your application adheres to modern web development standards, including accessibility and crossbrowser compatibility.
Deliverables:
A modified
file with your Djs visualization integrated.
An updated JavaScript file examplejs or a new file containing your data processing, visualization, and interactivity code.
An enhanced CSS file stylecss with additional styling for your dashboard.
Evaluation Criteria:
Correctness and efficiency of data processing and visualization.
Creativity and usability of the interactive elements.
Aesthetic appeal and responsiveness of the webpage design.
Code organization, readability, and documentation.
This challenge covers a broad spectrum of skills and allows candidates to demonstrate their proficiency in frontend development, data manipulation, and visualization techniques.
Step by Step Solution
There are 3 Steps involved in it
Step: 1

Get Instant Access to Expert-Tailored Solutions
See step-by-step solutions with expert insights and AI powered tools for academic success
Step: 2

Step: 3
Ace Your Homework with AI
Get the answers you need in no time with our AI-driven, step-by-step assistance
Get Started
Fundamentals Of Database Management Systems
Authors: Mark L. Gillenson
2nd Edition
0470624701, 978-0470624708