Comment briefly on the companys overall situation by comparing the items in these income statements. (for 2018 and 2019 only)
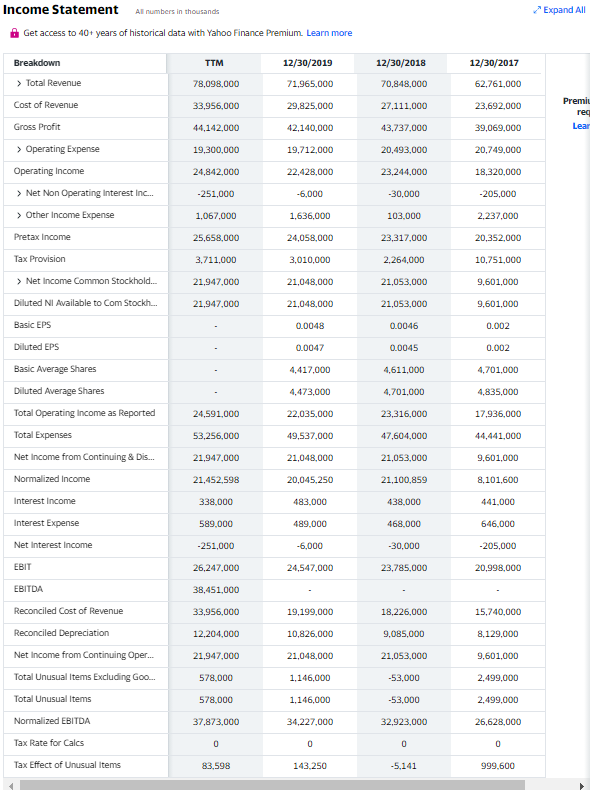
Income Statement Al numbers in thousands Expand All Get access to 40+ years of historical data with Yahoo Finance Premium. Learn more Breakdown TTM 12/30/2019 12/30/2018 12/30/2017 > Total Revenue 78,098,000 71,965,000 70,848,000 62,761.000 Cost of Revenue 33,956,000 29,825,000 27.111,000 23,692.000 Premit rec Lear Gross Profit 44,142,000 42,140,000 43,737,000 39,069.000 > Operating Expense 19,300,000 19,712,000 20,493,000 20,749,000 Operating Income 24,842,000 22.428,000 23.244.000 18,320,000 > Net Non Operating Interest Inc... -251,000 -6,000 -30,000 -205,000 > Other Income Expense 1,067,000 1,636,000 103.000 2.237.000 Pretax Income 25,658,000 24,058,000 23,317,000 20,352,000 Tax Provision 3,711,000 3.010,000 2,264,000 10,751,000 > Net Income Common Stockhold... 21,947,000 21,048,000 21,053,000 9,601,000 Diluted Ni Available to Com Stockh... 21.947.000 21.048,000 21,053,000 9,601,000 Basic EPS 0.0048 0.0046 0.002 0.0047 0.0045 0.002 4,417,000 4,611,000 4,701,000 Diluted EPS Basic Average Shares Diluted Average Shares Total Operating Income as Reported 4.473.000 4,701,000 4,835,000 24,591,000 22.035,000 23,316,000 17,936.000 Total Expenses 53,256,000 49,537,000 47,604,000 44,441,000 Net Income from Continuing & Dis... 21.947.000 21.048,000 21,053,000 9,601,000 21,452,598 20,045,250 21,100.859 8,101,600 Normalized Income Interest income 338.000 483.000 438,000 441.000 Interest Expense 589.000 489.000 468,000 646,000 Net Interest Income -251.000 -6,000 -30,000 -205,000 EBIT 26,247,000 24,547,000 23,785,000 20.998,000 EBITDA 38,451,000 33,956,000 19,199,000 18,226,000 15,740,000 Reconciled Cost of Revenue Reconciled Depreciation 12,204,000 10,826,000 9,085.000 8.129.000 Net Income from Continuing Oper... 21.947,000 21,048,000 21,053,000 9,601,000 578,000 1,146,000 -53,000 2,499.000 Total Unusual Items Excluding Goo... Total Unusual Items 578,000 1,146,000 -53,000 2.499,000 Normalized EBITDA 37.873,000 34,227,000 32,923,000 26,628,000 Tax Rate for Calcs 0 0 0 0 Tax Effect of Unusual Items 83,598 143.250 -5,141 999,600 Income Statement Al numbers in thousands Expand All Get access to 40+ years of historical data with Yahoo Finance Premium. Learn more Breakdown TTM 12/30/2019 12/30/2018 12/30/2017 > Total Revenue 78,098,000 71,965,000 70,848,000 62,761.000 Cost of Revenue 33,956,000 29,825,000 27.111,000 23,692.000 Premit rec Lear Gross Profit 44,142,000 42,140,000 43,737,000 39,069.000 > Operating Expense 19,300,000 19,712,000 20,493,000 20,749,000 Operating Income 24,842,000 22.428,000 23.244.000 18,320,000 > Net Non Operating Interest Inc... -251,000 -6,000 -30,000 -205,000 > Other Income Expense 1,067,000 1,636,000 103.000 2.237.000 Pretax Income 25,658,000 24,058,000 23,317,000 20,352,000 Tax Provision 3,711,000 3.010,000 2,264,000 10,751,000 > Net Income Common Stockhold... 21,947,000 21,048,000 21,053,000 9,601,000 Diluted Ni Available to Com Stockh... 21.947.000 21.048,000 21,053,000 9,601,000 Basic EPS 0.0048 0.0046 0.002 0.0047 0.0045 0.002 4,417,000 4,611,000 4,701,000 Diluted EPS Basic Average Shares Diluted Average Shares Total Operating Income as Reported 4.473.000 4,701,000 4,835,000 24,591,000 22.035,000 23,316,000 17,936.000 Total Expenses 53,256,000 49,537,000 47,604,000 44,441,000 Net Income from Continuing & Dis... 21.947.000 21.048,000 21,053,000 9,601,000 21,452,598 20,045,250 21,100.859 8,101,600 Normalized Income Interest income 338.000 483.000 438,000 441.000 Interest Expense 589.000 489.000 468,000 646,000 Net Interest Income -251.000 -6,000 -30,000 -205,000 EBIT 26,247,000 24,547,000 23,785,000 20.998,000 EBITDA 38,451,000 33,956,000 19,199,000 18,226,000 15,740,000 Reconciled Cost of Revenue Reconciled Depreciation 12,204,000 10,826,000 9,085.000 8.129.000 Net Income from Continuing Oper... 21.947,000 21,048,000 21,053,000 9,601,000 578,000 1,146,000 -53,000 2,499.000 Total Unusual Items Excluding Goo... Total Unusual Items 578,000 1,146,000 -53,000 2.499,000 Normalized EBITDA 37.873,000 34,227,000 32,923,000 26,628,000 Tax Rate for Calcs 0 0 0 0 Tax Effect of Unusual Items 83,598 143.250 -5,141 999,600