

Question
Common Stock Valuation - using the free cash flow model of stock valuation, computer the price per share of Amazon's common stock. Compared the actual
Common Stock Valuation - using the free cash flow model of stock valuation, computer the price per share of Amazon's common stock. Compared the actual market price to the interesting value.
Balance Sheet
Please show all work in excel!
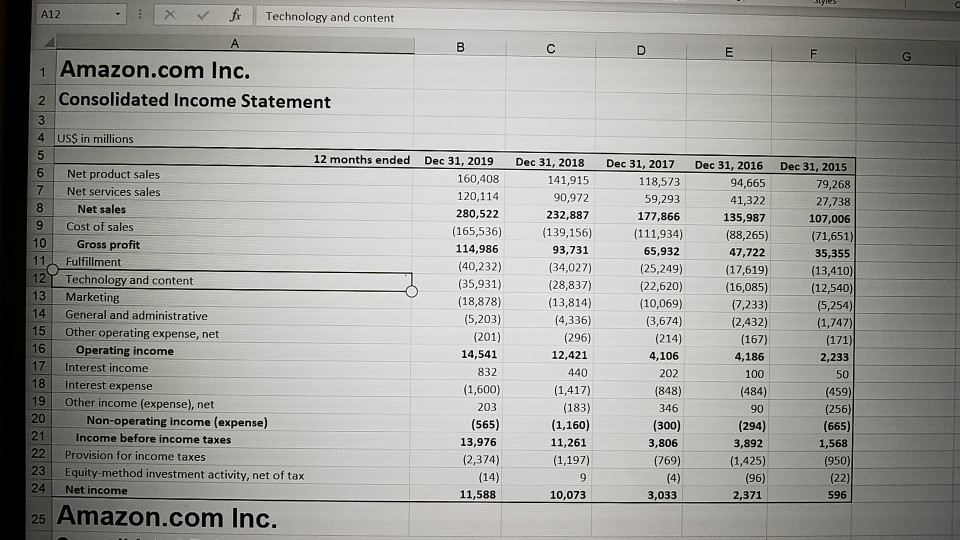
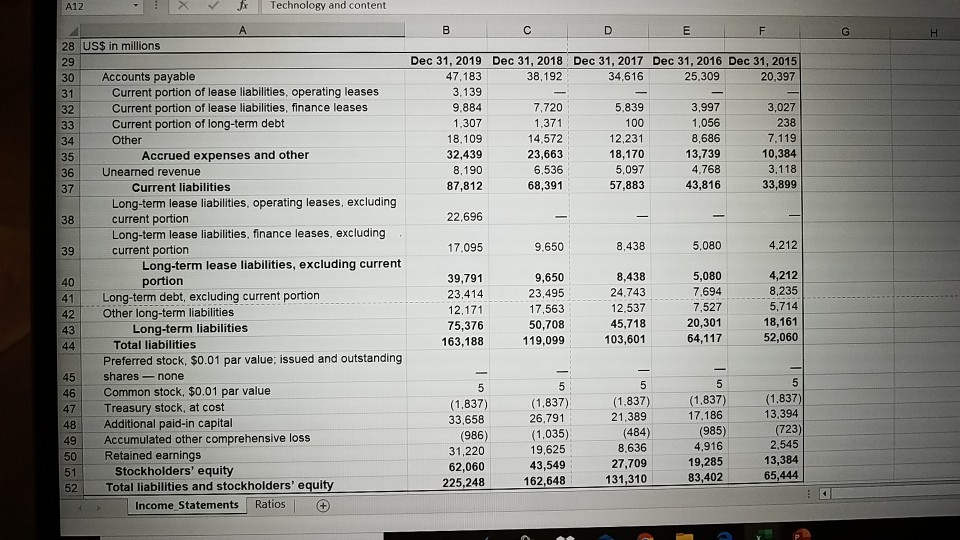
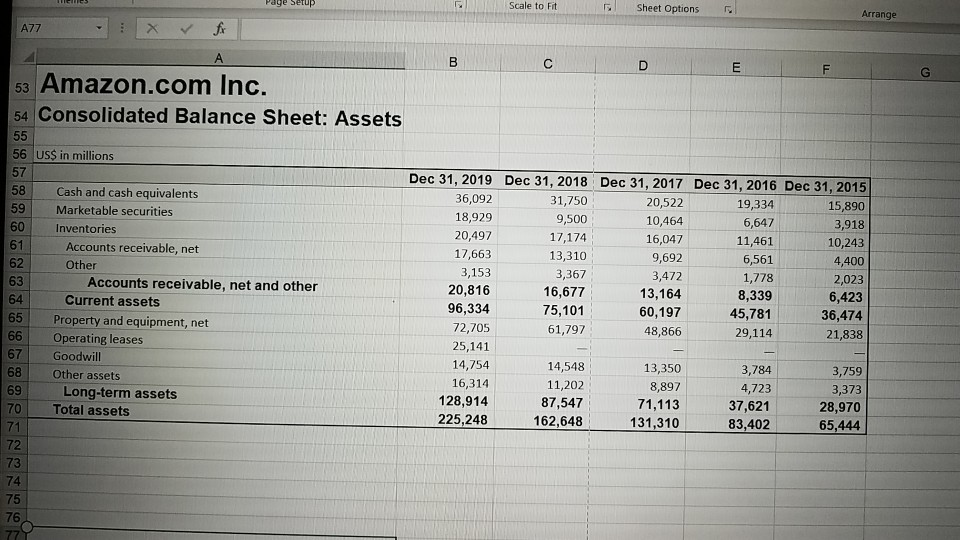
A12 - X for Technology and content 1 Amazon.com Inc. 2 Consolidated Income Statement 4 USS in millions 12 months ended 6 Net product sales 7 Net services sales Net sales 9 Cost of sales 10 Gross profit 11. Fulfillment 12 Y Technology and content 13 Marketing 14 General and administrative Other operating expense, net Operating income 17 Interest income Interest expense 19 Other income (expense), net Non-operating income (expense) 21 Income before income taxes 22 Provision for income taxes 23 Equity-method investment activity, net of tax 24 Net income Dec 31, 2019 160,408 120,114 280,522 (165,536) 114,986 (40,232) (35,931) (18,878) (5,203) (201) 14,541 832 (1,600) 203 (565) 13,976 (2,374) (14) 11,588 Dec 31, 2018 141,915 90,972 232,887 (139,156) 93,731 (34,027) (28,837) (13,814) (4,336) (296) 12,421 440 (1,417) (183) (1,160) 11,261 (1,197) Dec 31, 2015 79,268 27,738 107,006 (71,651) 35,355 (13,410) (12,540) (5,254) (1,747) Dec 31, 2017 118,573 59,293 177,866 (111,934) 65,932 (25,249) (22,620) (10,069) (3,674) (214) 4,106 202 (848) 346 (300) 3,806 (769) (4) 3,033 Dec 31, 2016 94,665 41,322 135,987 (88,265) 47,722 (17,619) (16,085) (7,233) (2,432) (167) 4,186 100 (484) 90 (294) 3,892 (1,425) (96) 2,371 15 Othe (171) 18 2,233 50 (459) (256) (665) 1,568 (950) (22) 10,073 596 25 Amazon.com Inc. X x Technology and content - A 28 US$ in millions 30 31 Dec 31, 2019 Dec 31, 2018 Dec 31, 2017 Dec 31, 2016 Dec 31, 2015 47.183 38,192 34,616 25,309 20,397 3.139 9.884 7.720 5.839 3,997 3,027 1,307 1,371 100 1,056 238 18.109 14,572 12,231 8,686 7,119 32,439 23,663 18,170 13,739 10,384 8,190 6,536 5,097 4.768 3,118 87,812 68,391 57,883 43,816 33,899 22,696 17.095 9,650 8,438 5,080 4.212 Accounts payable Current portion of lease liabilities, operating leases Current portion of lease liabilities, finance leases Current portion of long-term debt Other Accrued expenses and other Unearned revenue Current liabilities Long-term lease liabilities, operating leases, excluding current portion Long-term lease liabilities, finance leases, excluding current portion Long-term lease liabilities, excluding current portion Long-term debt, excluding current portion Other long-term liabilities Long-term liabilities Total liabilities Preferred stock. $0.01 par value; issued and outstanding shares - none Common stock, $0.01 par value Treasury stock, at cost Additional paid-in capital Accumulated other comprehensive loss Retained earnings Stockholders' equity Total liabilities and stockholders' equity Income Statements Ratios 39,791 23,414 12,171 75,376 163,188 9,650 23,495 17,563 50,708 119,099 8,438 24,743 12,537 45,718 103,601 5,080 7.694 7,527 20,301 64,117 4,212 8,235 5,714 18,161 52,060 43 49 50 (1,837) 33,658 (986) 31,220 62,060 225,248 (1.837) 26,791 (1,035) 19,625 43,549 162,648 (1,837) 21,389 (484) 8.636 27,709 131,310 (1.837) 17.186 (985) 4,916 19,285 83,402 (1,837) 13,394 (723) 2,545 13,384 65,444 51 52 rage setup Scale to Fit Sheet Options Arrange DE A77 x V fx D A 53 Amazon.com Inc. 54 Consolidated Balance Sheet: Assets 56 US$ in millions Cash and cash equivalents Marketable securities Inventories Accounts receivable, net Other Accounts receivable, net and other Current assets Property and equipment, net Operating leases Goodwill Other assets Long-term assets Total assets Dec 31, 2019 Dec 31, 2018 Dec 31, 2017 Dec 31, 2016 Dec 31, 2015 36,092 31,750 20,522 19,334 15,890 18,929 9,500 10,464 6,647 3,918 20,497 17,174 16,047 11,461 10,243 17,663 13,310 9,692 6,561 4,400 3,153 3,367 3,472 1,778 2,023 20,816 16,677 13,164 8,339 6,423 96,334 75,101 60,197 45,781 36,474 72,705 61,797 48,866 29,114 21,838 25,141 14,754 14,548 13,350 3,784 3,759 16,314 11,202 8,897 4,723 3,373 128,914 87,547 71,113 37,621 28,970 225,248 162,648 131,310 83,402 65,444 A12 - X for Technology and content 1 Amazon.com Inc. 2 Consolidated Income Statement 4 USS in millions 12 months ended 6 Net product sales 7 Net services sales Net sales 9 Cost of sales 10 Gross profit 11. Fulfillment 12 Y Technology and content 13 Marketing 14 General and administrative Other operating expense, net Operating income 17 Interest income Interest expense 19 Other income (expense), net Non-operating income (expense) 21 Income before income taxes 22 Provision for income taxes 23 Equity-method investment activity, net of tax 24 Net income Dec 31, 2019 160,408 120,114 280,522 (165,536) 114,986 (40,232) (35,931) (18,878) (5,203) (201) 14,541 832 (1,600) 203 (565) 13,976 (2,374) (14) 11,588 Dec 31, 2018 141,915 90,972 232,887 (139,156) 93,731 (34,027) (28,837) (13,814) (4,336) (296) 12,421 440 (1,417) (183) (1,160) 11,261 (1,197) Dec 31, 2015 79,268 27,738 107,006 (71,651) 35,355 (13,410) (12,540) (5,254) (1,747) Dec 31, 2017 118,573 59,293 177,866 (111,934) 65,932 (25,249) (22,620) (10,069) (3,674) (214) 4,106 202 (848) 346 (300) 3,806 (769) (4) 3,033 Dec 31, 2016 94,665 41,322 135,987 (88,265) 47,722 (17,619) (16,085) (7,233) (2,432) (167) 4,186 100 (484) 90 (294) 3,892 (1,425) (96) 2,371 15 Othe (171) 18 2,233 50 (459) (256) (665) 1,568 (950) (22) 10,073 596 25 Amazon.com Inc. X x Technology and content - A 28 US$ in millions 30 31 Dec 31, 2019 Dec 31, 2018 Dec 31, 2017 Dec 31, 2016 Dec 31, 2015 47.183 38,192 34,616 25,309 20,397 3.139 9.884 7.720 5.839 3,997 3,027 1,307 1,371 100 1,056 238 18.109 14,572 12,231 8,686 7,119 32,439 23,663 18,170 13,739 10,384 8,190 6,536 5,097 4.768 3,118 87,812 68,391 57,883 43,816 33,899 22,696 17.095 9,650 8,438 5,080 4.212 Accounts payable Current portion of lease liabilities, operating leases Current portion of lease liabilities, finance leases Current portion of long-term debt Other Accrued expenses and other Unearned revenue Current liabilities Long-term lease liabilities, operating leases, excluding current portion Long-term lease liabilities, finance leases, excluding current portion Long-term lease liabilities, excluding current portion Long-term debt, excluding current portion Other long-term liabilities Long-term liabilities Total liabilities Preferred stock. $0.01 par value; issued and outstanding shares - none Common stock, $0.01 par value Treasury stock, at cost Additional paid-in capital Accumulated other comprehensive loss Retained earnings Stockholders' equity Total liabilities and stockholders' equity Income Statements Ratios 39,791 23,414 12,171 75,376 163,188 9,650 23,495 17,563 50,708 119,099 8,438 24,743 12,537 45,718 103,601 5,080 7.694 7,527 20,301 64,117 4,212 8,235 5,714 18,161 52,060 43 49 50 (1,837) 33,658 (986) 31,220 62,060 225,248 (1.837) 26,791 (1,035) 19,625 43,549 162,648 (1,837) 21,389 (484) 8.636 27,709 131,310 (1.837) 17.186 (985) 4,916 19,285 83,402 (1,837) 13,394 (723) 2,545 13,384 65,444 51 52 rage setup Scale to Fit Sheet Options Arrange DE A77 x V fx D A 53 Amazon.com Inc. 54 Consolidated Balance Sheet: Assets 56 US$ in millions Cash and cash equivalents Marketable securities Inventories Accounts receivable, net Other Accounts receivable, net and other Current assets Property and equipment, net Operating leases Goodwill Other assets Long-term assets Total assets Dec 31, 2019 Dec 31, 2018 Dec 31, 2017 Dec 31, 2016 Dec 31, 2015 36,092 31,750 20,522 19,334 15,890 18,929 9,500 10,464 6,647 3,918 20,497 17,174 16,047 11,461 10,243 17,663 13,310 9,692 6,561 4,400 3,153 3,367 3,472 1,778 2,023 20,816 16,677 13,164 8,339 6,423 96,334 75,101 60,197 45,781 36,474 72,705 61,797 48,866 29,114 21,838 25,141 14,754 14,548 13,350 3,784 3,759 16,314 11,202 8,897 4,723 3,373 128,914 87,547 71,113 37,621 28,970 225,248 162,648 131,310 83,402 65,444Step by Step Solution
There are 3 Steps involved in it
Step: 1

Get Instant Access to Expert-Tailored Solutions
See step-by-step solutions with expert insights and AI powered tools for academic success
Step: 2

Step: 3
Ace Your Homework with AI
Get the answers you need in no time with our AI-driven, step-by-step assistance
Get Started
Personal Financial Planning
Authors: Lawrence J. Gitman, Michael D. Joehnk, Randy Billingsley
12th Edition
1439044473, 978-1439044476