Answered step by step
Verified Expert Solution
Link Copied!

Question

1 Approved Answer

Common text for questions 3 and 4 The Russell 1000 (R1000) is a value-weighted index of the largest 1,000 U.S. stocks. The Russell 2000 (R2000)
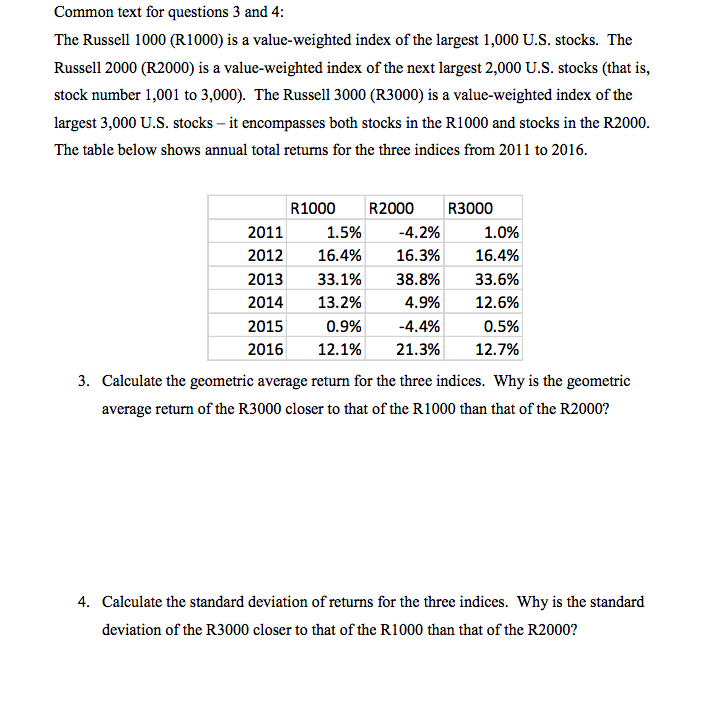
image text in transcribed

Common text for questions 3 and 4 The Russell 1000 (R1000) is a value-weighted index of the largest 1,000 U.S. stocks. The Russell 2000 (R2000) is a value-weighted index of the next largest 2,000 U.S. stocks (that is, stock number 1,001 to 3,000). The Russell 3000 (R3000) is a value-weighted index of the largest 3,000 U.S. stocks - it encompasses both stocks in the R1000 and stocks in the R2000 The table below shows annual total returns for the three indices from 2011 to 2016 R1000 R2000 R3000 1.5% -4.2% 1.0% 2011 2012 16.4% 16.3% 16.4% 2013 33.1% 38.8% 33.6% 2014 13.2% 2015 2016 12.1% 21.3% 12.7% 4.9% -4.4% 12.6% 0.9% 0.5% 3. Calculate the geometric average return for the three indices. Why is the geometric average return of the R3000 closer to that of the R1000 than that of the R2000? 4. Calculate the standard deviation of returns for the three indices. Why is the standard deviation of the R3000 closer to that of the R1000 than that of the R2000

Step by Step Solution

There are 3 Steps involved in it

Step: 1

blur-text-image

Get Instant Access to Expert-Tailored Solutions

See step-by-step solutions with expert insights and AI powered tools for academic success

Step: 2

blur-text-image

Step: 3

blur-text-image

Ace Your Homework with AI

Get the answers you need in no time with our AI-driven, step-by-step assistance

Get Started

Recommended Textbook for

The Handbook Of Financial Instruments

Authors: Frank J. Fabozzi

1st Edition

0471220922, 978-0471220923

More Books

Students also viewed these Finance questions