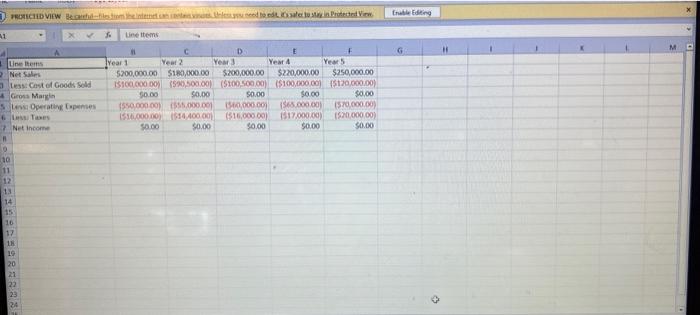
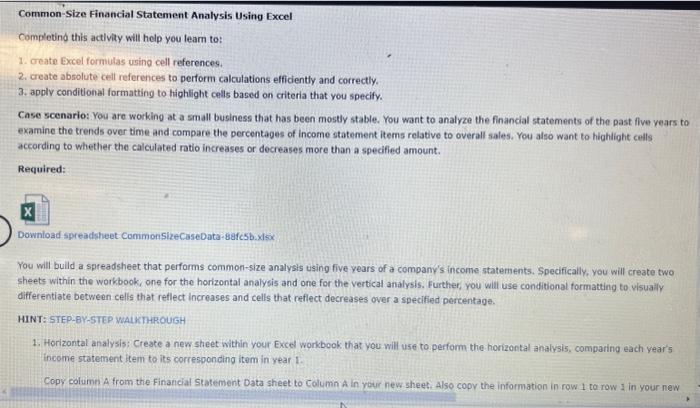
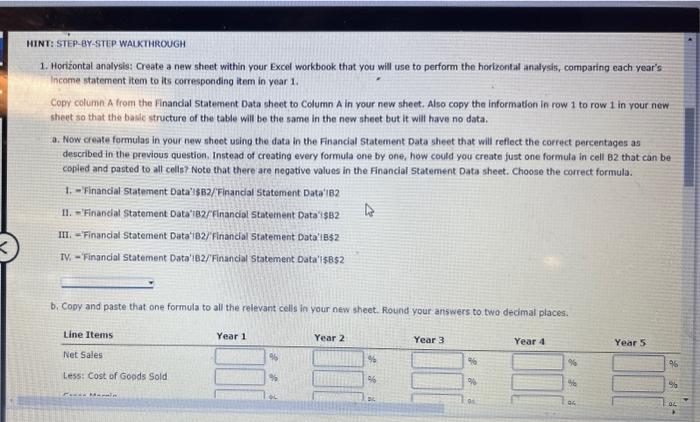
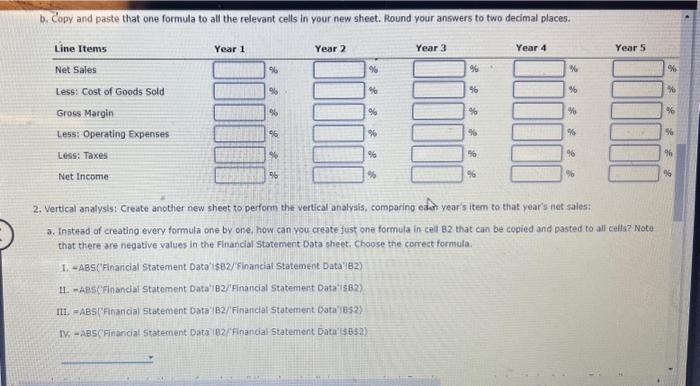
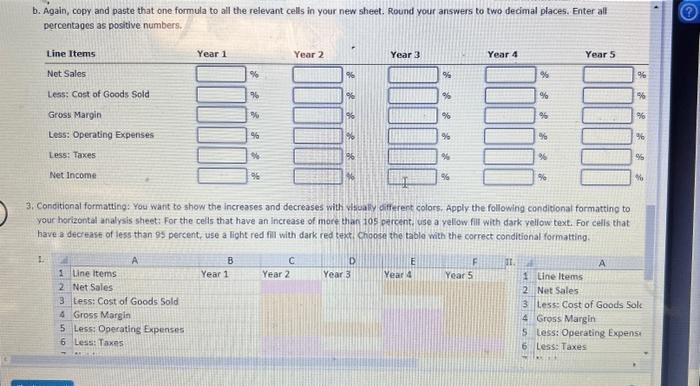
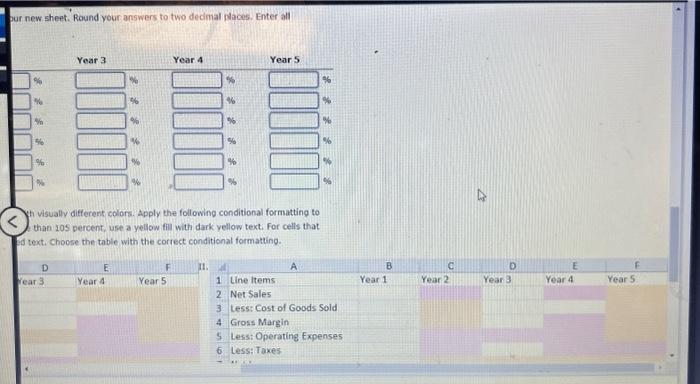
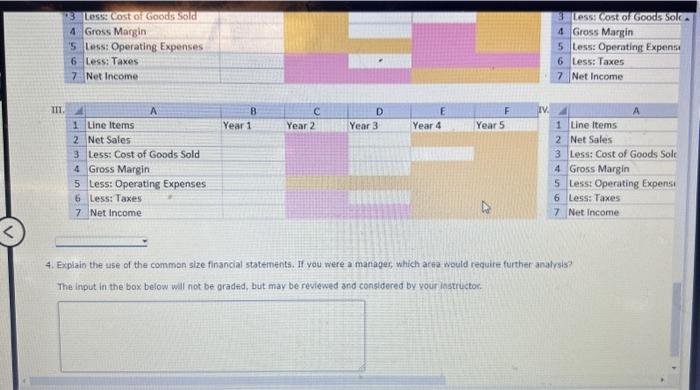
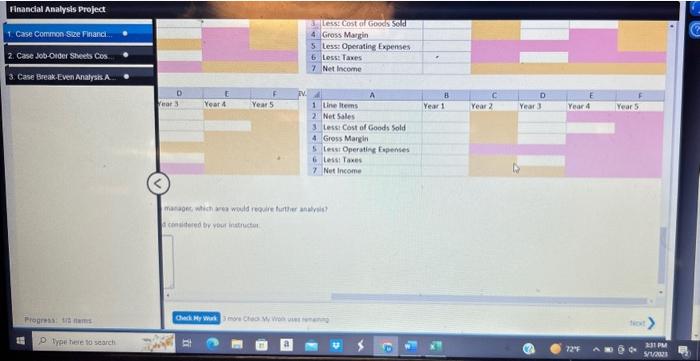
Common-Size Financial Statement Analysis Using Excel Completind this actlvity will help you learn to: 1. create Excel formulas using cell references. 2. create absolute ceil references to perform calculations efficiently and correctly. 3. apply conditional formatting to highlight cells based on criteria that you specify. Case scenario: You are working at a small business that has been mostly stable. You want to analyze the financial statements of the past five years to examine the trends over time and compare the percentages of income statement items relative to overall sales. You also want to highlight cells according to whether the calculated ratio increases or decreases more than a specified amount. Required: Download spreadsheet CommonslzeCaseData-88afcsb.xdsix You will bulld a spreadsheet that performs common-size analysis using five years of a company's income staternents. Specifically, you will create two sheets within the workbook, one for the horizontal analysis and one for the vertical analysis. Further, you will use conditional formatting to visualy. differentiate between cells that reflect increases and cells that reflect decreases over a specified percentage. HINT: SIEP-BY-STEP WALKTHROUGH 1. Horizontal analysis: Create a new sheet within your Excel workbook that you will use to perform the horizontal analysis, conparing each year's income statement lem to its corresponding itom in year 1 . Copy column A trom the Financial Statement Data sheet to Column A in your new sheet Also copy the information in row I to row 1 in your new 1. Horizontal analysig: Create a new sheet within your Excol workbook that you will use to perform the horizontal anadysis, comparing each year's Income statement item to its corresponding item in yoar 1. Copr column A from the Finandal Statement Data sheet to Column A in your new sheet. Also copy the information in row 1 to row 1 in your new sheet so that the basic structure of the table will be the same in the new sheet but it will have no data. a. Now create formulas in your new sheot using the data in the Financial Statement Data sheet that will reflect the correct percentages as described in the previous question. Instead of creating every formula one by one, how could you create fust one formula in cell B2 that can be copied and pasted to all celis? Noto that there are negative valuos in the Financial Statement Data sheet. Choose the correct formula. 1. - Financial Statement Data'lsB2/Financial Statement Data'1B2 11. -'Financial Statement Data"182 FFInancial Staternent Data'I\$B? III. ='Finandal Statement Data'i82/Finandal Statement Data'i B52 TV. - Finandal Statement Data'ib2/Financial Statement Data'i\$8\$2 2. vertical analysis: Create another new sheet to perform the vertical analyais, comparing ean year's item to that year's net sales: 3. Insteadd af creating every formula one by one, how can you create fust one formula in cell B2 that can be copied and pasted to all cells? Note that there are negative values in the Financial Statement Data cheet. Choose the correct formula. 1. - ABS('Finandal Statement Data'is8/Financiat Statement Data'i82) 11. -AesCFinanciai Statement Data'1 82/ FInandal Statement Data'is82) IIL. =ABS(Financial Statement Data'iB2/'Finandal Statement Cata'i6s?) IV - ABS (Financial Staternent Data'i82 / Financial Statement Data' 14852 ) b. Again, copy and paste that one formula to all the relevant cells in your new sheet. Round your answers to two decimal places. Enter all percentaoes as positive numbers. 3. Conditional formatting: You want to show the increases and decreases with visualy differert colors. Apply the following condibional formatting to your horizontal analysis sheet: For the cells that have an increase of more than fos percent, use a yeliow fill with dark yellow text. For cells that bave a decrease of less than 95 percent, use a light red fil with dark red text, Choose the table with the correct conditional formatting. our new sheet. Round your answers to two dedmal phacos. Enter all hi visually different colors. Apply the following conditional formatting to than 105 percent, use a yellow fill with dark yellow text. For cells that Ed text. choose the table with the correct conditional formatting. 4. Explain the use of the common size financial statements. If vou were a manager, which area nould require further analrsis? The input in the box below wil not be graded, but may be reviewed and consldered by vour iastructor. mataget, which are? would rooule turt?ler ahalyali? 4 considered by your instructur Common-Size Financial Statement Analysis Using Excel Completind this actlvity will help you learn to: 1. create Excel formulas using cell references. 2. create absolute ceil references to perform calculations efficiently and correctly. 3. apply conditional formatting to highlight cells based on criteria that you specify. Case scenario: You are working at a small business that has been mostly stable. You want to analyze the financial statements of the past five years to examine the trends over time and compare the percentages of income statement items relative to overall sales. You also want to highlight cells according to whether the calculated ratio increases or decreases more than a specified amount. Required: Download spreadsheet CommonslzeCaseData-88afcsb.xdsix You will bulld a spreadsheet that performs common-size analysis using five years of a company's income staternents. Specifically, you will create two sheets within the workbook, one for the horizontal analysis and one for the vertical analysis. Further, you will use conditional formatting to visualy. differentiate between cells that reflect increases and cells that reflect decreases over a specified percentage. HINT: SIEP-BY-STEP WALKTHROUGH 1. Horizontal analysis: Create a new sheet within your Excel workbook that you will use to perform the horizontal analysis, conparing each year's income statement lem to its corresponding itom in year 1 . Copy column A trom the Financial Statement Data sheet to Column A in your new sheet Also copy the information in row I to row 1 in your new 1. Horizontal analysig: Create a new sheet within your Excol workbook that you will use to perform the horizontal anadysis, comparing each year's Income statement item to its corresponding item in yoar 1. Copr column A from the Finandal Statement Data sheet to Column A in your new sheet. Also copy the information in row 1 to row 1 in your new sheet so that the basic structure of the table will be the same in the new sheet but it will have no data. a. Now create formulas in your new sheot using the data in the Financial Statement Data sheet that will reflect the correct percentages as described in the previous question. Instead of creating every formula one by one, how could you create fust one formula in cell B2 that can be copied and pasted to all celis? Noto that there are negative valuos in the Financial Statement Data sheet. Choose the correct formula. 1. - Financial Statement Data'lsB2/Financial Statement Data'1B2 11. -'Financial Statement Data"182 FFInancial Staternent Data'I\$B? III. ='Finandal Statement Data'i82/Finandal Statement Data'i B52 TV. - Finandal Statement Data'ib2/Financial Statement Data'i\$8\$2 2. vertical analysis: Create another new sheet to perform the vertical analyais, comparing ean year's item to that year's net sales: 3. Insteadd af creating every formula one by one, how can you create fust one formula in cell B2 that can be copied and pasted to all cells? Note that there are negative values in the Financial Statement Data cheet. Choose the correct formula. 1. - ABS('Finandal Statement Data'is8/Financiat Statement Data'i82) 11. -AesCFinanciai Statement Data'1 82/ FInandal Statement Data'is82) IIL. =ABS(Financial Statement Data'iB2/'Finandal Statement Cata'i6s?) IV - ABS (Financial Staternent Data'i82 / Financial Statement Data' 14852 ) b. Again, copy and paste that one formula to all the relevant cells in your new sheet. Round your answers to two decimal places. Enter all percentaoes as positive numbers. 3. Conditional formatting: You want to show the increases and decreases with visualy differert colors. Apply the following condibional formatting to your horizontal analysis sheet: For the cells that have an increase of more than fos percent, use a yeliow fill with dark yellow text. For cells that bave a decrease of less than 95 percent, use a light red fil with dark red text, Choose the table with the correct conditional formatting. our new sheet. Round your answers to two dedmal phacos. Enter all hi visually different colors. Apply the following conditional formatting to than 105 percent, use a yellow fill with dark yellow text. For cells that Ed text. choose the table with the correct conditional formatting. 4. Explain the use of the common size financial statements. If vou were a manager, which area nould require further analrsis? The input in the box below wil not be graded, but may be reviewed and consldered by vour iastructor. mataget, which are? would rooule turt?ler ahalyali? 4 considered by your instructur