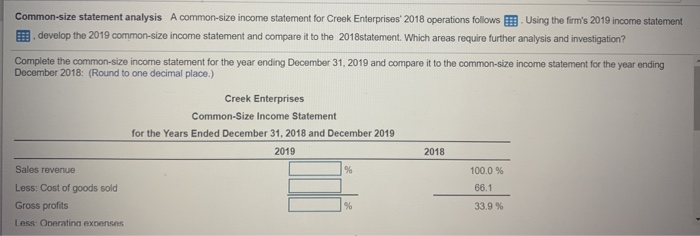
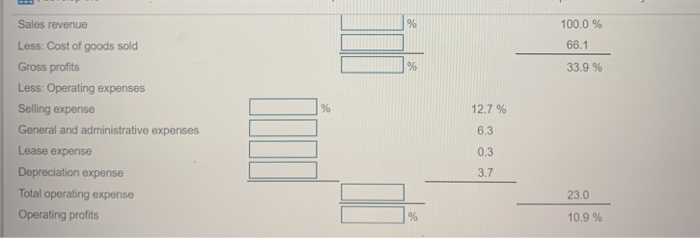
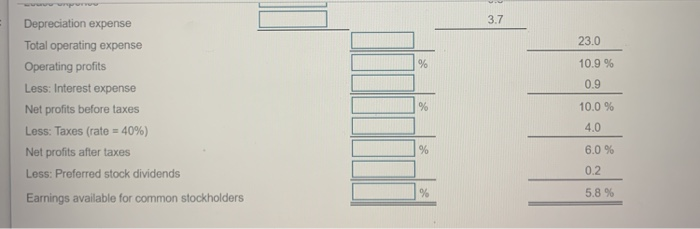
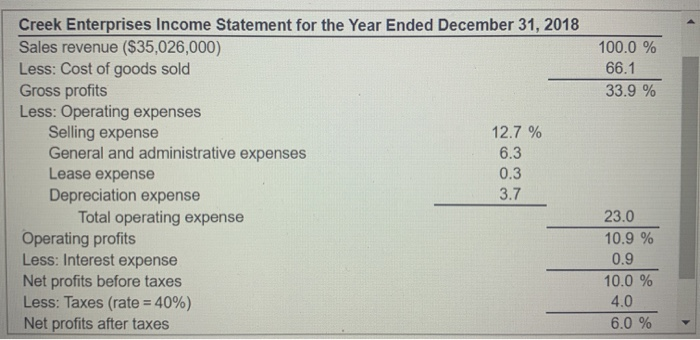
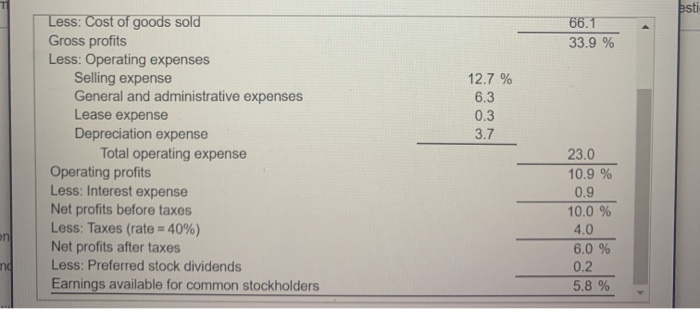
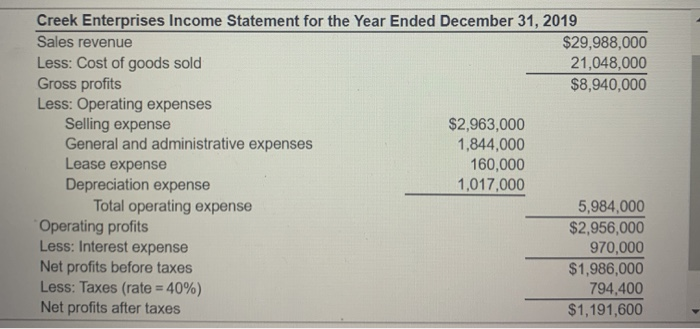
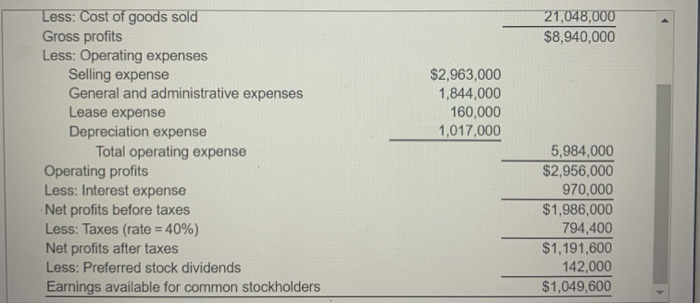
Common-size statement analysis A common-size income statement for Creek Enterprises 2018 operations follows Using the firm's 2019 income statement develop the 2019 common-size income statement and compare it to the 2018statement. Which areas require further analysis and investigation? Complete the common-size income statement for the year ending December 31, 2019 and compare it to the common-size income statement for the year ending December 2018: (Round to one decimal place.) Creek Enterprises Common-Size Income Statement for the Years Ended December 31, 2018 and December 2019 2019 2018 % 100.0 % 66.1 Sales revenue Less: Cost of goods sold Gross profits Less: Operating expenses % 33.9% Sales revenue % 100.0 % 66.1 % 33.9 % % 12.7 % Less: Cost of goods sold Gross profits Less: Operating expenses Selling expense General and administrative expenses Lease expense Depreciation expense Total operating expense Operating profits 6.3 0.3 3.7 23.0 % 10.9 % 3.7 23.0 % 10.9 % 0.9 % Depreciation expense Total operating expense Operating profits Less: Interest expense Net profits before taxes Less: Taxes (rate = 40%) Net profits after taxes Less: Preferred stock dividends Earnings available for common stockholders 10.0 % 4.0 % 6.0 % 0.2 % 5.8 % 100.0 % 66.1 33.9 % Creek Enterprises Income Statement for the Year Ended December 31, 2018 Sales revenue ($35,026,000) Less: Cost of goods sold Gross profits Less: Operating expenses Selling expense 12.7 % General and administrative expenses 6.3 Lease expense 0.3 Depreciation expense 3.7 Total operating expense Operating profits Less: Interest expense Net profits before taxes Less: Taxes (rate = 40%) Net profits after taxes 23.0 10.9 % 0.9 10.0 % 4.0 6.0 % psti 66.1 33.9 % 12.7 % 6.3 0.3 3.7 Less: Cost of goods sold Gross profits Less: Operating expenses Selling expense General and administrative expenses Lease expense Depreciation expense Total operating expense Operating profits Less: Interest expense Net profits before taxes Less: Taxes (rate = 40%) Net profits after taxes Less: Preferred stock dividends Earnings available for common stockholders 23.0 10.9 % 0.9 10.0 % 4.0 6.0 % an no 0.2 5.8 % Creek Enterprises Income Statement for the Year Ended December 31, 2019 Sales revenue $29,988,000 Less: Cost of goods sold 21,048,000 Gross profits $8,940,000 Less: Operating expenses Selling expense $2,963,000 General and administrative expenses 1,844,000 Lease expense 160,000 Depreciation expense 1,017,000 Total operating expense 5,984,000 Operating profits $2,956,000 Less: Interest expense 970,000 Net profits before taxes $1,986,000 Less: Taxes (rate = 40%) 794,400 Net profits after taxes $1,191,600 21,048,000 $8,940,000 $2,963,000 1,844,000 160,000 1,017,000 Less: Cost of goods sold Gross profits Less: Operating expenses Selling expense General and administrative expenses Lease expense Depreciation expense Total operating expense Operating profits Less: Interest expense Net profits before taxes Less: Taxes (rate = 40%) Net profits after taxes Less: Preferred stock dividends Earnings available for common stockholders 5,984,000 $2,956,000 970,000 $1,986,000 794,400 $1,191,600 142,000 $1,049,600