

Answered step by step
Verified Expert Solution
Question
1 Approved Answer
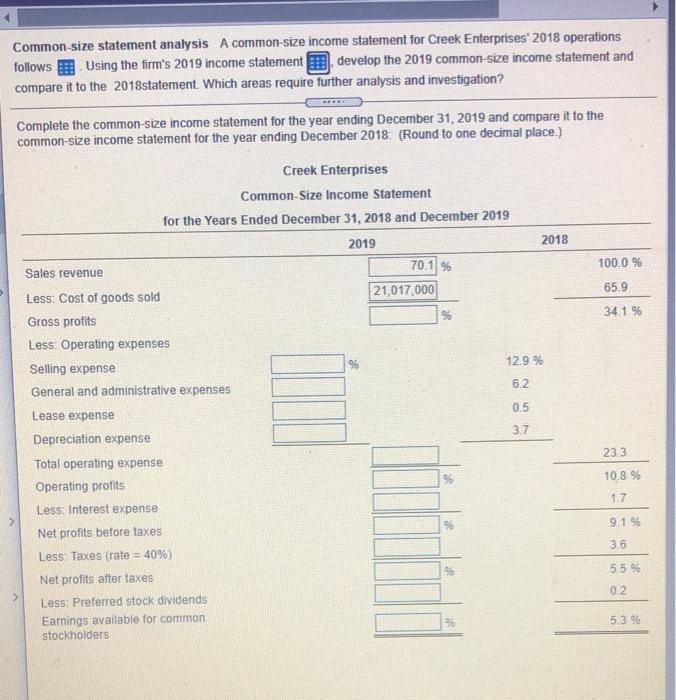
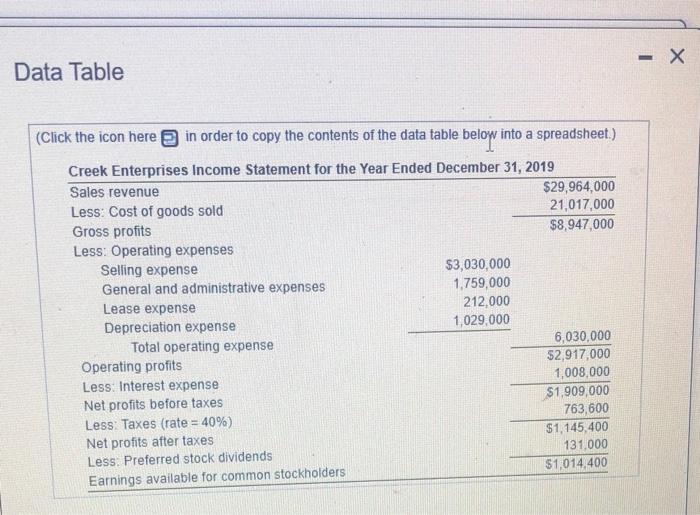
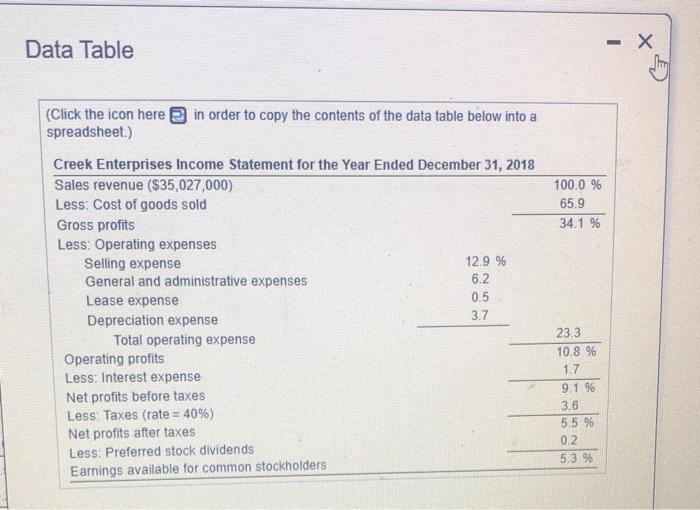
Common-size statement analysis A common-size income statement for Creek Enterprises' 2018 operations follows Using the firm's 2019 income statement develop the 2019 common-size income statement
Step by Step Solution
There are 3 Steps involved in it
Step: 1

Get Instant Access to Expert-Tailored Solutions
See step-by-step solutions with expert insights and AI powered tools for academic success
Step: 2

Step: 3
Ace Your Homework with AI
Get the answers you need in no time with our AI-driven, step-by-step assistance
Get Started
The Changing Politics Of Finance In Korea And Thailand From Deregulation To Debacle
Authors: Xiaoke Zhang
1st Edition
1138811815, 9781138811812