

Question
Common-size statement analysis A common-size income statement for Creek Enterprises 2018 operations follows Using the firm's 20 income statement, develop the 2019 common-size income
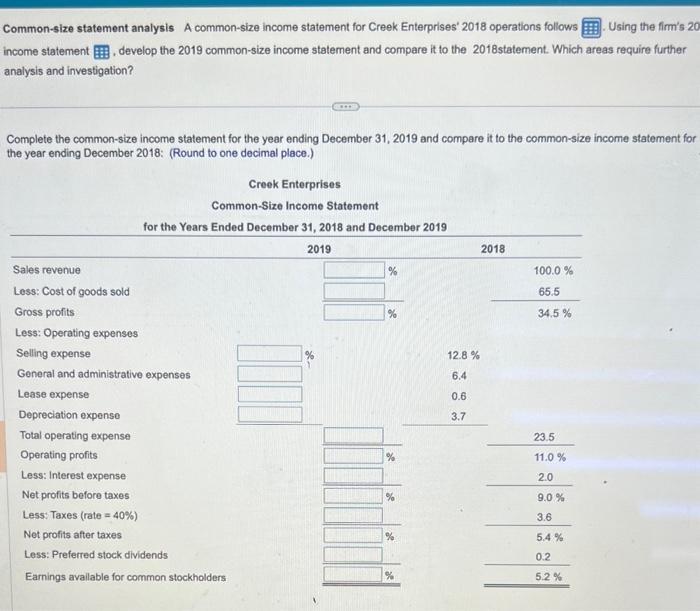
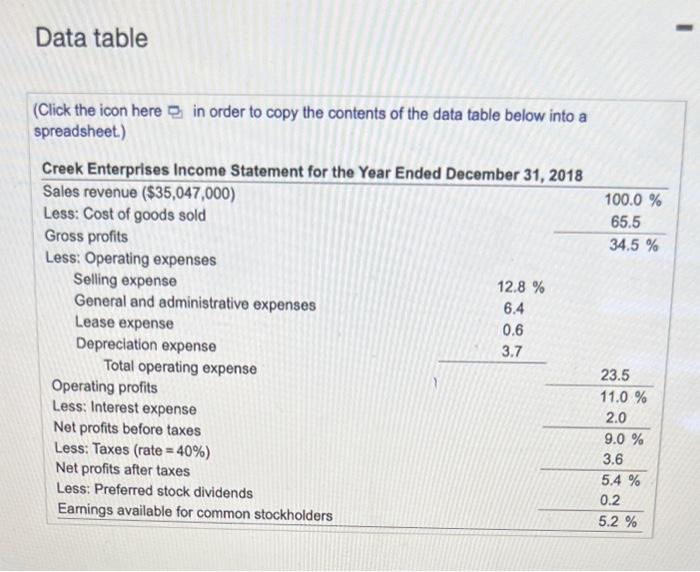
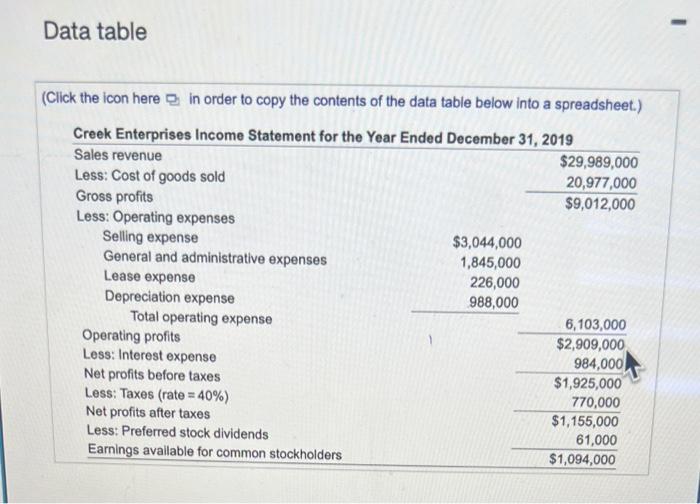
Common-size statement analysis A common-size income statement for Creek Enterprises 2018 operations follows Using the firm's 20 income statement, develop the 2019 common-size income statement and compare it to the 2018statement. Which areas require further analysis and investigation? Complete the common-size income statement for the year ending December 31, 2019 and compare it to the common-size income statement for the year ending December 2018: (Round to one decimal place.) Creek Enterprises Common-Size Income Statement for the Years Ended December 31, 2018 and December 2019 2019 Sales revenue Less: Cost of goods sold Gross profits Less: Operating expenses Selling expense General and administrative expenses Lease expense Depreciation expense Total operating expense Operating profits Less: Interest expense Net profits before taxes Less: Taxes (rate=40%) Net profits after taxes Less: Preferred stock dividends Earnings available for common stockholders % % % % % 12.8% 6.4 0.6 3.7 2018 100.0 % 65.5 34.5 % 23.5 11.0 % 2.0 9.0 % 3.6 5.4% 0.2 5.2 % Data table (Click the icon here in order to copy the contents of the data table below into a spreadsheet.) Creek Enterprises Income Statement for the Year Ended December 31, 2018 Sales revenue ($35,047,000) Less: Cost of goods sold Gross profits Less: Operating expenses Selling expense General and administrative expenses Lease expense Depreciation expense Total operating expense Operating profits Less: Interest expense Net profits before taxes Less: Taxes (rate=40%) Net profits after taxes Less: Preferred stock dividends Earnings available for common stockholders 12.8 % 6.4 0.6 3.7 100.0 % 65.5 34.5% 23.5 11.0% 2.0 9.0 % 3.6 5.4 % 0.2 5.2% I Data table (Click the icon here in order to copy the contents of the data table below into a spreadsheet.) Creek Enterprises Income Statement for the Year Ended December 31, 2019 Sales revenue Less: Cost of goods sold Gross profits Less: Operating expenses Selling expense General and administrative expenses Lease expense Depreciation expense Total operating expense Operating profits Less: Interest expense Net profits before taxes Less: Taxes (rate=40%) Net profits after taxes Less: Preferred stock dividends Earnings available for common stockholders $3,044,000 1,845,000 226,000 988,000 $29,989,000 20,977,000 $9,012,000 6,103,000 $2,909,000 984,000 $1,925,000 770,000 $1,155,000 61,000 $1,094,000
Step by Step Solution
There are 3 Steps involved in it
Step: 1

Get Instant Access with AI-Powered Solutions
See step-by-step solutions with expert insights and AI powered tools for academic success
Step: 2

Step: 3
Ace Your Homework with AI
Get the answers you need in no time with our AI-driven, step-by-step assistance
Get Started
Principles of Managerial Finance
Authors: Chad J. Zutter, Scott B. Smart
15th edition
978-0134476315
