Answered step by step
Verified Expert Solution
Question
1 Approved Answer
COMP163 Drunken Driver Program The National Highway Traffic Safety Administration has a database containing information on all of the fatal accidents in the United States,


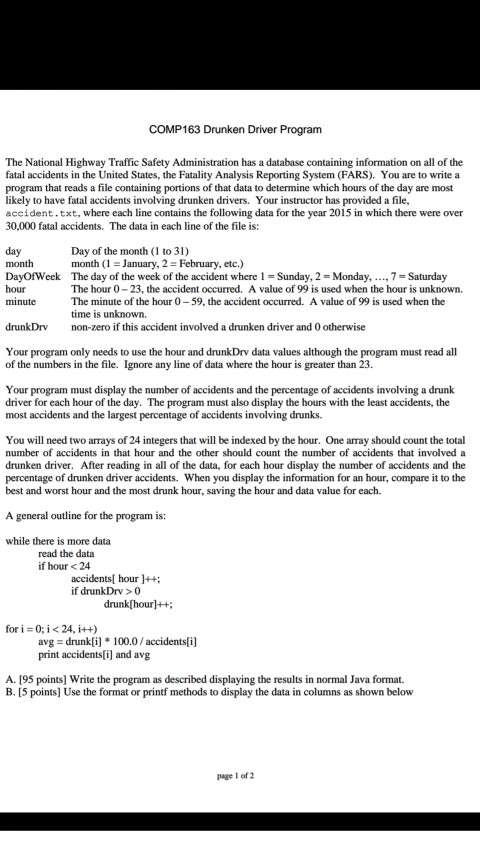
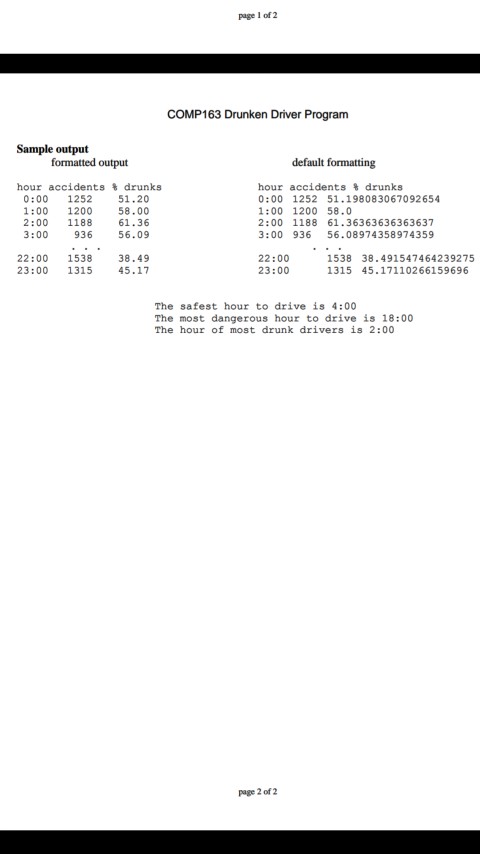
COMP163 Drunken Driver Program The National Highway Traffic Safety Administration has a database containing information on all of the fatal accidents in the United States, the Fatality Analysis Reporting System (FARS). You are to write a program that reads a file containing portions of that data to determine which hours of the day are most likely to have fatal accidents involving drunken drivers. Your instructor has provided a file, accident.txt, where each line 30,000 fatal accidents. The data in each line of the file is: contains the following data for the year 2015 i which there were over day month DayOfWeek hour minute Day of the month (1 to 31) month (1-January, 2-February, etc.) The day of the week of the accident where 1 = Sunday, 2 = Monday, The hour 0-23, the accident occurred, A value of 99 is used when the hour is unknown. The minute of the hour 0-59, the accident occurred. A value of 99 is used when the time is unknown. , 7 = Saturday drunkDrv on-zero if this accident involved a drunken driver and 0 otherwise Your program only needs to use the hour and drunkDrv data values although the program must read all of the numbers in the file. Ignore any line of data where the hour is greater than 23. Your program must display the number of accidents and the percentage of accidents involving a drunk driver for each hour of the day. The program must also display the hours with the least accidents, the most accidents and the largest percentage of accidents involving drunks. You will need two arrays of 24 integers that will be indexed by the hour. One array should count the total number of accidents in that hour and the other should count the number of accidents that involved a drunken driver. After reading in all of the data, for each hour display the number of accidents and the percentage of drunken driver accidents. When you display the information for an hour, compare it to the best and worst hour and the most drunk hour, saving the hour and data value for each. A general outline for the program is: while there is more data read the data if hour
Step by Step Solution
There are 3 Steps involved in it
Step: 1

Get Instant Access to Expert-Tailored Solutions
See step-by-step solutions with expert insights and AI powered tools for academic success
Step: 2

Step: 3

Ace Your Homework with AI
Get the answers you need in no time with our AI-driven, step-by-step assistance
Get Started


