

Question
Companies E and F sell computers and related equipment. One company sells high-performance computing systems (supercomputers) to government agencies, universities, and commercial businesses. It has
Companies E and F sell computers and related equipment. One company sells high-performance computing systems (supercomputers) to government agencies, universities, and commercial businesses. It has experienced considerable growth due to an increasing customer base. The company is financially conservative.
The other company sells personal computers as well as handheld devices and software. The firm has been able to differentiate itself by using its own operating system for its computers and by creating new and innovative designs for all its products. These products carry premium prices domestically and globally. The company follows a vertical integration strategy starting with owning chip manufacturers and ending with owning its own retail stores.
what doe these do ratios mean? What can they tell us about the financial health or condition of one company relative to another?
For instance, you mentioned LT debt/ shareholder's equity. Why might these ratios be different? Feel free to speculate.
Similarly, you described the inventory turnover ratios, but the values are missing. What do these numbers look like?
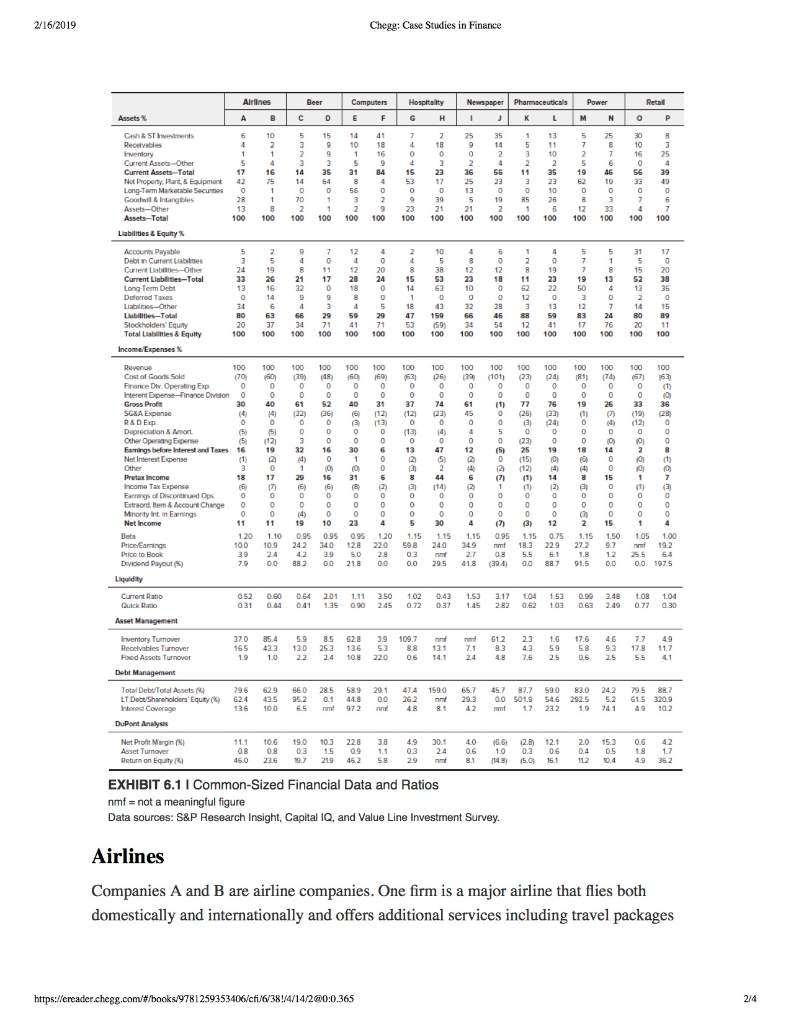
2/16/2019 Chegg: Case Studies in Finance Newspaper Pharmaceuticals Power Assets Cash & ST estments 10 5 15 14 41 10 18 35 10 25 Current Assets-Other Current Assets Total Not Property Pant &Equipment 42 Long-Term Markotable Secunties0 Goodwil &Intangbles 14 3 31 84 19 46 3 23 62 1334 S6 39 o 6419 19 85 26 21 Assets-Total 100 100 100 100 100 100 100 100 100 100 100 100 100 100 100 100 Labilities & Equity % Accourts Payable Debt in Current Liabises Current Libie-Other Current Liabilities-Total Long-Term Deb 3 1223 17 28 24 62 22 50 13 36 15 66 29 59 29 34 71 4 753 (59 34 54 12 41 159 Stockholders Equity Total Liabilities &Equity 100 100 100 100 100 100 00 100 00 100 00 100 100 100 00 100 100 100 100 100 100 100 1 100 100 100 100 100 100 100 100 100 Finance Diw. Operaing Exp hterent Expense-rinance Diviston Gross Proft 61 2 40 31 (22) (1 77 76 9233 36 0 @6) (12) (12) (23) 45 (26) (33) (1) (19) R R&D Exp Depreciation& mort Other Operaang Expense Eantg,beforehteestandTses16 19 32 16 30 6 13 47 12 25191814 Net Interest Expense 0 034) (2 18 17 29 16 31 447()14 8 15 Extraord. Rem & Account Change o Mnority Int in Earmings Net Income 19 10 23 5304(7) ) 12 1.20 1.10 0.95 095 0.95 120 1.15 1.15 1.15 0.95 1.15 0.75 1.15 150 105 100 100 10.9 24.2 34.0 12.8 22.0 59.8 24.0 34.9 mmf 18.3 22.9 27.2 9.7 nmf 19.2 3.9 2.4 4.2 3950 28 0.3 nnt 27 0.8 5.5 61 1.8 1.2 .5 64 7.9 00 88.2 0.0 21.8 00 0.0 29.5 41.8 (39 0.0 88.7 91.5 0.0 0.0 197.5 Dividend Payout ) 052 0.60 064 201 1130 043 1.53 3.17 104 153 99 3.4 108 1.04 031 044 041 1.35 090 245 0.72 037 1.45 2.82 0.62 103 063 2.49 0.77 a30 Current Ratio Asset Management Inventory Turmover Recelvables Turnover 370 05.4 5.9 0.5 628 3.9 109.7 mmf n 61.2 2.1 1.6 17.6 4.6 7.7 165 43.3 13.0 25.3 136 53 88 9.3 4.3 9 S.8 9.3 179 11.7 1.9 1.0 2.2 24 08220 0.6 14.1 244.8 2.6 2.5 06 2.5 5541 Howod Assets Turnover Total Debt/Total Assets LTDetShareholders. Eqty(9 624 435 95.2 0.1 448 00 262 n 29,3 0.0 S01.9 S4.6 292.5 2 G1.532a9 96 629 6.0 28.5 589 291 474 159.0 657 45.7 87.7 S9.0 83.0 242 79.5 887 136 10.0 6.5 m972 nnt 4 81 2 nmf 1.7 232 1.9 741 4g 10.2 DuPont Analysis Net Profit Mergn%) 11.1 10.6 19.0 10.] 22.8 3.5 4.9 30.1 4,06)029 12.1 2.0 15.3 0.5 42 Asset Turmover 0.8 0.3 15 09 .1 0.3 24 06 1.00.3060.4 0.5 Return on Equity EXHIBIT 6.1 I Common-Sized Financial Data and Ratios Data sources: S&P Research Insight, Capital IQ, and Value Line Investment Survey. 46.0 23.6 19.7 219 46.2 5.8 2.9 m 8.1 (4.8) (5.0 16.1 n2 10.4 4.9 36.2 ot a meaningful figure Airlines Companies A and B are airline companies. One firm is a major airline that flies both domestically and internationally and offers additional services including travel packages https://creader.chegg.com/#/books/g781 25935 3406/cfi/6/381/4/1 4/2@0:0.365 2/16/2019 Chegg: Case Studies in Finance Newspaper Pharmaceuticals Power Assets Cash & ST estments 10 5 15 14 41 10 18 35 10 25 Current Assets-Other Current Assets Total Not Property Pant &Equipment 42 Long-Term Markotable Secunties0 Goodwil &Intangbles 14 3 31 84 19 46 3 23 62 1334 S6 39 o 6419 19 85 26 21 Assets-Total 100 100 100 100 100 100 100 100 100 100 100 100 100 100 100 100 Labilities & Equity % Accourts Payable Debt in Current Liabises Current Libie-Other Current Liabilities-Total Long-Term Deb 3 1223 17 28 24 62 22 50 13 36 15 66 29 59 29 34 71 4 753 (59 34 54 12 41 159 Stockholders Equity Total Liabilities &Equity 100 100 100 100 100 100 00 100 00 100 00 100 100 100 00 100 100 100 100 100 100 100 1 100 100 100 100 100 100 100 100 100 Finance Diw. Operaing Exp hterent Expense-rinance Diviston Gross Proft 61 2 40 31 (22) (1 77 76 9233 36 0 @6) (12) (12) (23) 45 (26) (33) (1) (19) R R&D Exp Depreciation& mort Other Operaang Expense Eantg,beforehteestandTses16 19 32 16 30 6 13 47 12 25191814 Net Interest Expense 0 034) (2 18 17 29 16 31 447()14 8 15 Extraord. Rem & Account Change o Mnority Int in Earmings Net Income 19 10 23 5304(7) ) 12 1.20 1.10 0.95 095 0.95 120 1.15 1.15 1.15 0.95 1.15 0.75 1.15 150 105 100 100 10.9 24.2 34.0 12.8 22.0 59.8 24.0 34.9 mmf 18.3 22.9 27.2 9.7 nmf 19.2 3.9 2.4 4.2 3950 28 0.3 nnt 27 0.8 5.5 61 1.8 1.2 .5 64 7.9 00 88.2 0.0 21.8 00 0.0 29.5 41.8 (39 0.0 88.7 91.5 0.0 0.0 197.5 Dividend Payout ) 052 0.60 064 201 1130 043 1.53 3.17 104 153 99 3.4 108 1.04 031 044 041 1.35 090 245 0.72 037 1.45 2.82 0.62 103 063 2.49 0.77 a30 Current Ratio Asset Management Inventory Turmover Recelvables Turnover 370 05.4 5.9 0.5 628 3.9 109.7 mmf n 61.2 2.1 1.6 17.6 4.6 7.7 165 43.3 13.0 25.3 136 53 88 9.3 4.3 9 S.8 9.3 179 11.7 1.9 1.0 2.2 24 08220 0.6 14.1 244.8 2.6 2.5 06 2.5 5541 Howod Assets Turnover Total Debt/Total Assets LTDetShareholders. Eqty(9 624 435 95.2 0.1 448 00 262 n 29,3 0.0 S01.9 S4.6 292.5 2 G1.532a9 96 629 6.0 28.5 589 291 474 159.0 657 45.7 87.7 S9.0 83.0 242 79.5 887 136 10.0 6.5 m972 nnt 4 81 2 nmf 1.7 232 1.9 741 4g 10.2 DuPont Analysis Net Profit Mergn%) 11.1 10.6 19.0 10.] 22.8 3.5 4.9 30.1 4,06)029 12.1 2.0 15.3 0.5 42 Asset Turmover 0.8 0.3 15 09 .1 0.3 24 06 1.00.3060.4 0.5 Return on Equity EXHIBIT 6.1 I Common-Sized Financial Data and Ratios Data sources: S&P Research Insight, Capital IQ, and Value Line Investment Survey. 46.0 23.6 19.7 219 46.2 5.8 2.9 m 8.1 (4.8) (5.0 16.1 n2 10.4 4.9 36.2 ot a meaningful figure Airlines Companies A and B are airline companies. One firm is a major airline that flies both domestically and internationally and offers additional services including travel packages https://creader.chegg.com/#/books/g781 25935 3406/cfi/6/381/4/1 4/2@0:0.365
Step by Step Solution
There are 3 Steps involved in it
Step: 1

Get Instant Access to Expert-Tailored Solutions
See step-by-step solutions with expert insights and AI powered tools for academic success
Step: 2

Step: 3
Ace Your Homework with AI
Get the answers you need in no time with our AI-driven, step-by-step assistance
Get Started
Nursing And Therapy Audit Evaluation Of Twenty Four Projects And Initiatives Evaluating Medical Audit
Authors: Judy Foster
1st Edition
1898845115, 978-1898845119