Question
company 1 Loblawas Valuation Measures Market Cap (intraday) 5 18.24B Enterprise Value 3 18.27B Trailing P/E 47.53 Forward P/E 1 N/A PEG Ratio (5 yr

company 1 Loblawas Valuation Measures Market Cap (intraday) 5 18.24B Enterprise Value 3 18.27B Trailing P/E 47.53 Forward P/E 1 N/A PEG Ratio (5 yr expected) 1 N/A Price/Sales (ttm) N/A Price/Book (mrq) 2.07 Enterprise Value/Revenue 3 N/A Enterprise Value/EBITDA 6 N/A Trading Information Stock Price History Beta (5Y Monthly) -0.09 52-Week Change 3 -0.14% S&P500 52-Week Change 3 7.73% 52 Week High 3 57.20 52 Week Low 3 43.27 50-Day Moving Average 3 49.15 200-Day Moving Average 3 50.36 Share Statistics Avg Vol (3 month) 3 1.9k Avg Vol (10 day) 3 175 Shares Outstanding 5 357.73M Float 168.96M % Held by Insiders 1 53.71% % Held by Institutions 1 24.15% Shares Short 4 N/A Short Ratio 4 N/A Short % of Float 4 N/A Short % of Shares Outstanding 4 N/A Shares Short (prior month ) 4 N/A Dividends & Splits Forward Annual Dividend Rate 4 0.89 Forward Annual Dividend Yield 4 1.75% Trailing Annual Dividend Rate 3 0.85 Trailing Annual Dividend Yield 3 1.66% 5 Year Average Dividend Yield 4 1.62 Payout Ratio 4 41.58% Dividend Date 3 Jul. 01, 2020 Ex-Dividend Date 4 Mar. 12, 2020 Last Split Factor 2 N/A Last Split Date 3 N/A Financial HighlightsCurrency in CAD. Fiscal Year Fiscal Year Ends Dec. 28, 2019 Most Recent Quarter (mrq) Mar. 21, 2020 Profitability Profit Margin 2.28% Operating Margin (ttm) 0.00% Management Effectiveness Return on Assets (ttm) 4.27% Return on Equity (ttm) 10.59% Income Statement Revenue (ttm) N/A Revenue Per Share (ttm) N/A Quarterly Revenue Growth (yoy) 10.70% Gross Profit (ttm) 14.76B EBITDA N/A Net Income Avi to Common (ttm) N/A Diluted EPS (ttm) 1.08 Quarterly Earnings Growth (yoy) 20.90% Balance Sheet Total Cash (mrq) N/A Total Cash Per Share (mrq) N/A Total Debt (mrq) N/A Total Debt/Equity (mrq) 151.29 Current Ratio (mrq) 1.31 Book Value Per Share (mrq) 24.72 Cash Flow Statement Operating Cash Flow (ttm) N/A Levered Free Cash Flow (ttm) N/A
company 2 Metro inc Valuation Measures Market Cap (intraday) 5 14.77B Enterprise Value 3 19.27B Trailing P/E 20.36 Forward P/E 1 17.30 PEG Ratio (5 yr expected) 1 1.94 Price/Sales (ttm) 0.86 Price/Book (mrq) 2.49 Enterprise Value/Revenue 3 1.13 Enterprise Value/EBITDA 6 13.72 Trading Information Stock Price History Beta (5Y Monthly) -0.12 52-Week Change 3 17.53% S&P500 52-Week Change 3 7.73% 52 Week High 3 61.74 52 Week Low 3 49.03 50-Day Moving Average 3 56.49 200-Day Moving Average 3 56.28 Share Statistics Avg Vol (3 month) 3 628.05k Avg Vol (10 day) 3 385.46k Shares Outstanding 5 251.77M Float 251.22M % Held by Insiders 1 0.14% % Held by Institutions 1 46.06% Shares Short (Jun. 30, 2020) 4 2.79M Short Ratio (Jun. 30, 2020) 4 3.53 Short % of Float (Jun. 30, 2020) 4 N/A Short % of Shares Outstanding (Jun. 30, 2020) 4 1.11% Shares Short (prior month May 29, 2020) 4 2.07M Dividends & Splits Forward Annual Dividend Rate 4 0.9 Forward Annual Dividend Yield 4 1.54% Trailing Annual Dividend Rate 3 0.85 Trailing Annual Dividend Yield 3 1.46% 5 Year Average Dividend Yield 4 1.42 Payout Ratio 4 28.65% Dividend Date 3 Jun. 12, 2020 Ex-Dividend Date 4 May 20, 2020 Last Split Factor 2 3:1 Last Split Date 3 Feb. 12, 2015 Financial Highlights Fiscal Year Fiscal Year Ends Sep. 28, 2019 Most Recent Quarter (mrq) Mar. 14, 2020 Profitability Profit Margin 4.29% Operating Margin (ttm) 6.59% Management Effectiveness Return on Assets (ttm) 5.94% Return on Equity (ttm) 12.53% Income Statement Revenue (ttm) 17.11B Revenue Per Share (ttm) 67.44 Quarterly Revenue Growth (yoy) 7.80% Gross Profit (ttm) 1.88B EBITDA 1.4B Net Income Avi to Common (ttm) 733.8M Diluted EPS (ttm) 2.88 Quarterly Earnings Growth (yoy) 45.60% Balance Sheet Total Cash (mrq) 217.8M Total Cash Per Share (mrq) 0.87 Total Debt (mrq) 4.8B Total Debt/Equity (mrq) 80.69 Current Ratio (mrq) 1.32 Book Value Per Share (mrq) 23.58 Cash Flow Statement Operating Cash Flow (ttm) 1.08B Levered Free Cash Flow (ttm) 388.29M
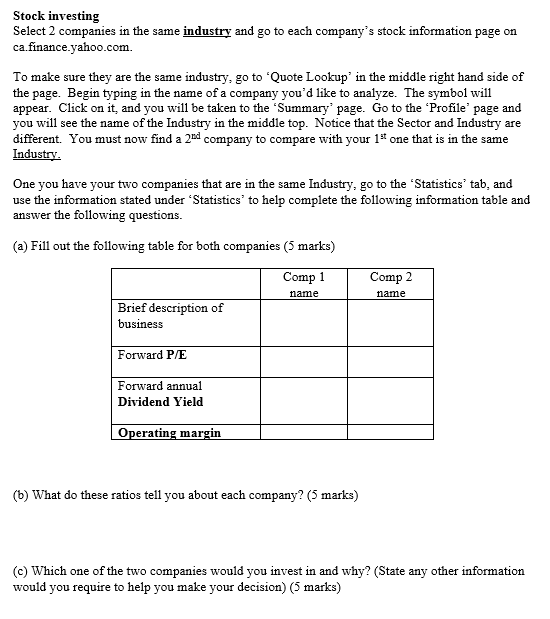
Stock investing Select 2 companies in the same industry and go to each company's stock information page on ca.finance.yahoo.com To make sure they are the same industry, go to 'Quote Lookup in the middle right hand side of the page. Begin typing in the name of a company you'd like to analyze. The symbol will appear. Click on it and you will be taken to the 'Summary page. Go to the Profile page and you will see the name of the Industry in the middle top. Notice that the Sector and Industry are different. You must now find a 2nd company to compare with your 1* one that is in the same Industry. One you have your two companies that are in the same Industry, go to the Statistics' tab, and use the information stated under 'Statistics' to help complete the following information table and answer the following questions. (a) Fill out the following table for both companies (5 marks) Comp 1 name Comp 2 name Brief description of business Forward P/E Forward annual Dividend Yield Operating margin (b) What do these ratios tell you about each company? (5 marks) (c) Which one of the two companies would you invest in and why? (State any other information would you require to help you make your decision) (5 marks) Stock investing Select 2 companies in the same industry and go to each company's stock information page on ca.finance.yahoo.com To make sure they are the same industry, go to 'Quote Lookup in the middle right hand side of the page. Begin typing in the name of a company you'd like to analyze. The symbol will appear. Click on it and you will be taken to the 'Summary page. Go to the Profile page and you will see the name of the Industry in the middle top. Notice that the Sector and Industry are different. You must now find a 2nd company to compare with your 1* one that is in the same Industry. One you have your two companies that are in the same Industry, go to the Statistics' tab, and use the information stated under 'Statistics' to help complete the following information table and answer the following questions. (a) Fill out the following table for both companies (5 marks) Comp 1 name Comp 2 name Brief description of business Forward P/E Forward annual Dividend Yield Operating margin (b) What do these ratios tell you about each company? (5 marks) (c) Which one of the two companies would you invest in and why? (State any other information would you require to help you make your decision)Step by Step Solution
There are 3 Steps involved in it
Step: 1

Get Instant Access to Expert-Tailored Solutions
See step-by-step solutions with expert insights and AI powered tools for academic success
Step: 2

Step: 3

Ace Your Homework with AI
Get the answers you need in no time with our AI-driven, step-by-step assistance
Get Started


