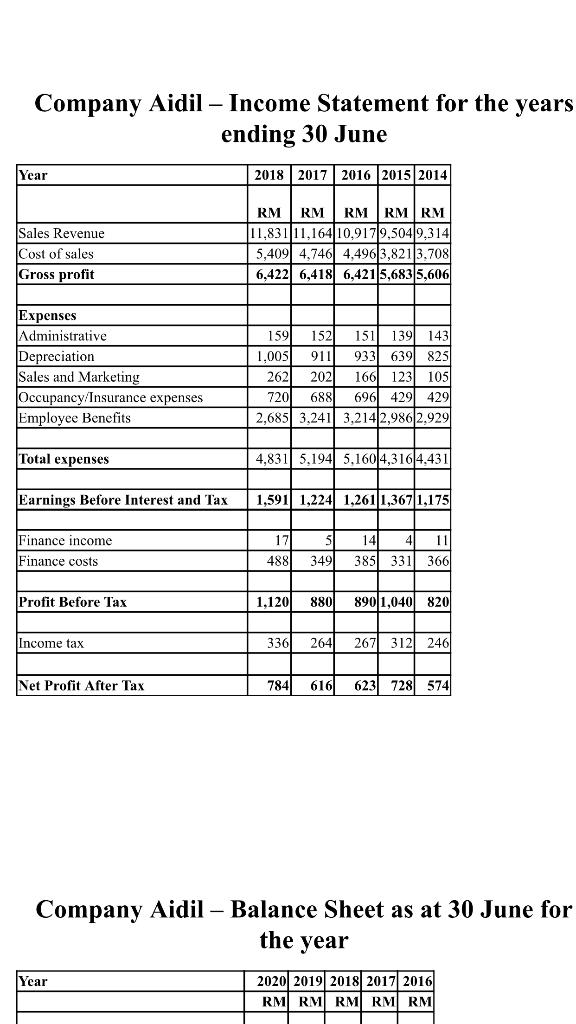
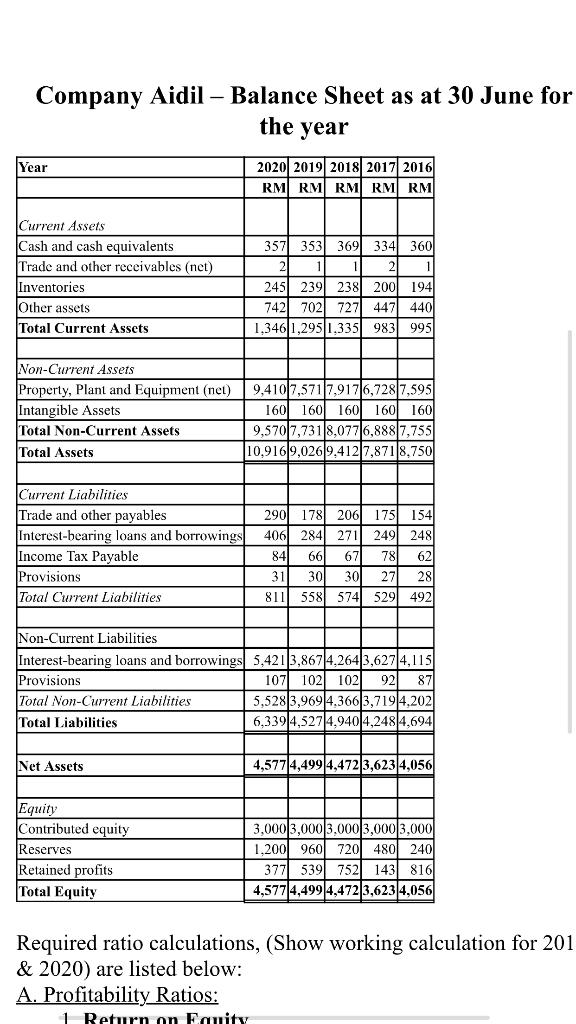
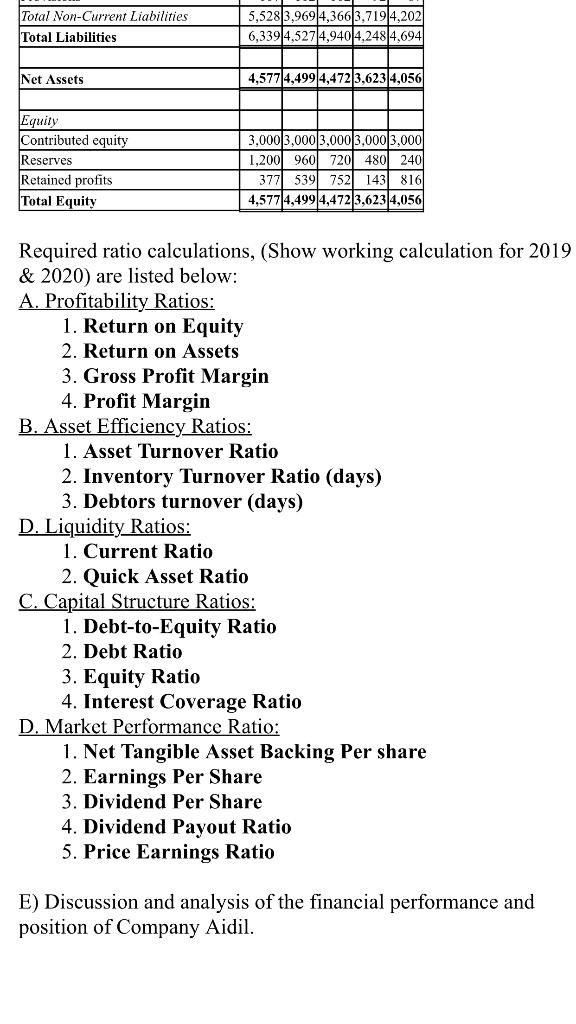
Company Aidil - Income Statement for the years ending 30 June Year 2018 2017 2016 2015 2014 Sales Revenue Cost of sales Gross profit RM RM RM RM RM 11.831 11,164/10,9179,504/9,314 5,409 4,746 4,496 3,821 3.708 6,422 6,418|6,421 5,6835,606 Expenses Administrative Depreciation Sales and Marketing Occupancy/Insurance expenses Employee Benefits 159 152 151 139 143 1.005 911 933 6391 8251 262 202 166 123 105 720 688 696 429 429 2,685 3,241 3,214 2,986 2,929 Total expenses 4,831 5.194 5,160 4,316 4.431 Earnings Before Interest and Tax 1,591 1,224 1.261 1,367 1,175 17 5 Finance income Finance costs 141 41 3851 331 11 366) 488 349 Profit Before Tax 1.120 880 890|1,040 8201 Income tax 336 264 267 312 2461 Net Profit After Tax 784 616 623 728 574 Company Aidil - Balance Sheet as at 30 June for the year Year 2020 2019 2018 2017 2016 RM RM RM RM RM Company Aidil Balance Sheet as at 30 June for the year Year 2020 2019 2018 2017 2016 RM RM RM RM RM Current Assets Cash and cash equivalents Trade and other receivables (net) Inventories Other assets Total Current Assets 357 353 369 1 245 239 238 742 702 727 1.346|1,295 1.335 3341 3601 21 1 200 194 447 440 9831 9951 Non-Current Assets Property, Plant and Equipment (net) Intangible Assets Total Non-Current Assets Total Assets 9,410 7,571 7,9176,72817,595 1601 1601 160 160 160 9,5707,731 8,0776,888 7,755 10,9169,0269.412 7,871 8.750 Current Liabilities Trade and other payables Interest-bearing loans and borrowings Income Tax Payable Provisions Total Current Liabilities 290 178 206 406 284 271 841 66 67 31 30 30 811 558 574 1751 154 249 248 78 62 27 28 529 492 Non-Current Liabilities Interest-bearing loans and borrowings 5,421 3,867 4.2643,627 4,115 Provisions 107 1021 1021 92 87 Total Non-Current Liabilities 5,5283,9694.3663,7194,202 Total Liabilities 6,3394,527 4.940|4,248|4,694 Net Assets 4,577 4,499 4,472 3,623 4,056 Equity Contributed equity Reserves Retained profits Total Equity 3,000 3,000 3.000 3,000 3,000 1.200 960 720 480 240 377 539 752 143 816 4,5774,499 4,472 3,623 4,056 Required ratio calculations, (Show working calculation for 201 & 2020) are listed below: A. Profitability Ratios: 1 Return on Fanity Total Non-Current Liabilities Total Liabilities 5,528 3.9694,366 3.719 4,202 6,339|4,527 4,940 4.248 4.694 Net Assets 4,577|4,499 4,472 3,623 4,056 Equity Contributed equity Reserves Retained profits Total Equity 3,000 3,000 3,000 3,000 3,000 1,200 960 720 480 240 3771 539 7521 143 816 4,577 4,499 4,472 3,623 4,056 Required ratio calculations, (Show working calculation for 2019 & 2020) are listed below: A. Profitability Ratios: 1. Return on Equity 2. Return on Assets 3. Gross Profit Margin 4. Profit Margin B. Asset Efficiency Ratios: 1. Asset Turnover Ratio 2. Inventory Turnover Ratio (days) 3. Debtors turnover (days) D. Liquidity Ratios: 1. Current Ratio 2. Quick Asset Ratio C. Capital Structure Ratios: 1. Debt-to-Equity Ratio 2. Debt Ratio 3. Equity Ratio 4. Interest Coverage Ratio D. Market Performance Ratio: 1. Net Tangible Asset Backing Per share 2. Earnings Per Share 3. Dividend Per Share 4. Dividend Payout Ratio 5. Price Earnings Ratio E) Discussion and analysis of the financial performance and position of Company Aidil. Company Aidil - Income Statement for the years ending 30 June Year 2018 2017 2016 2015 2014 Sales Revenue Cost of sales Gross profit RM RM RM RM RM 11.831 11,164/10,9179,504/9,314 5,409 4,746 4,496 3,821 3.708 6,422 6,418|6,421 5,6835,606 Expenses Administrative Depreciation Sales and Marketing Occupancy/Insurance expenses Employee Benefits 159 152 151 139 143 1.005 911 933 6391 8251 262 202 166 123 105 720 688 696 429 429 2,685 3,241 3,214 2,986 2,929 Total expenses 4,831 5.194 5,160 4,316 4.431 Earnings Before Interest and Tax 1,591 1,224 1.261 1,367 1,175 17 5 Finance income Finance costs 141 41 3851 331 11 366) 488 349 Profit Before Tax 1.120 880 890|1,040 8201 Income tax 336 264 267 312 2461 Net Profit After Tax 784 616 623 728 574 Company Aidil - Balance Sheet as at 30 June for the year Year 2020 2019 2018 2017 2016 RM RM RM RM RM Company Aidil Balance Sheet as at 30 June for the year Year 2020 2019 2018 2017 2016 RM RM RM RM RM Current Assets Cash and cash equivalents Trade and other receivables (net) Inventories Other assets Total Current Assets 357 353 369 1 245 239 238 742 702 727 1.346|1,295 1.335 3341 3601 21 1 200 194 447 440 9831 9951 Non-Current Assets Property, Plant and Equipment (net) Intangible Assets Total Non-Current Assets Total Assets 9,410 7,571 7,9176,72817,595 1601 1601 160 160 160 9,5707,731 8,0776,888 7,755 10,9169,0269.412 7,871 8.750 Current Liabilities Trade and other payables Interest-bearing loans and borrowings Income Tax Payable Provisions Total Current Liabilities 290 178 206 406 284 271 841 66 67 31 30 30 811 558 574 1751 154 249 248 78 62 27 28 529 492 Non-Current Liabilities Interest-bearing loans and borrowings 5,421 3,867 4.2643,627 4,115 Provisions 107 1021 1021 92 87 Total Non-Current Liabilities 5,5283,9694.3663,7194,202 Total Liabilities 6,3394,527 4.940|4,248|4,694 Net Assets 4,577 4,499 4,472 3,623 4,056 Equity Contributed equity Reserves Retained profits Total Equity 3,000 3,000 3.000 3,000 3,000 1.200 960 720 480 240 377 539 752 143 816 4,5774,499 4,472 3,623 4,056 Required ratio calculations, (Show working calculation for 201 & 2020) are listed below: A. Profitability Ratios: 1 Return on Fanity Total Non-Current Liabilities Total Liabilities 5,528 3.9694,366 3.719 4,202 6,339|4,527 4,940 4.248 4.694 Net Assets 4,577|4,499 4,472 3,623 4,056 Equity Contributed equity Reserves Retained profits Total Equity 3,000 3,000 3,000 3,000 3,000 1,200 960 720 480 240 3771 539 7521 143 816 4,577 4,499 4,472 3,623 4,056 Required ratio calculations, (Show working calculation for 2019 & 2020) are listed below: A. Profitability Ratios: 1. Return on Equity 2. Return on Assets 3. Gross Profit Margin 4. Profit Margin B. Asset Efficiency Ratios: 1. Asset Turnover Ratio 2. Inventory Turnover Ratio (days) 3. Debtors turnover (days) D. Liquidity Ratios: 1. Current Ratio 2. Quick Asset Ratio C. Capital Structure Ratios: 1. Debt-to-Equity Ratio 2. Debt Ratio 3. Equity Ratio 4. Interest Coverage Ratio D. Market Performance Ratio: 1. Net Tangible Asset Backing Per share 2. Earnings Per Share 3. Dividend Per Share 4. Dividend Payout Ratio 5. Price Earnings Ratio E) Discussion and analysis of the financial performance and position of Company Aidil