Answered step by step
Verified Expert Solution
Question
1 Approved Answer
Company Exelon INSTRUCTIONS: The table below shows a brief history of daily percentage Royal Dutch Shell returns for four well-known energy companies as well as
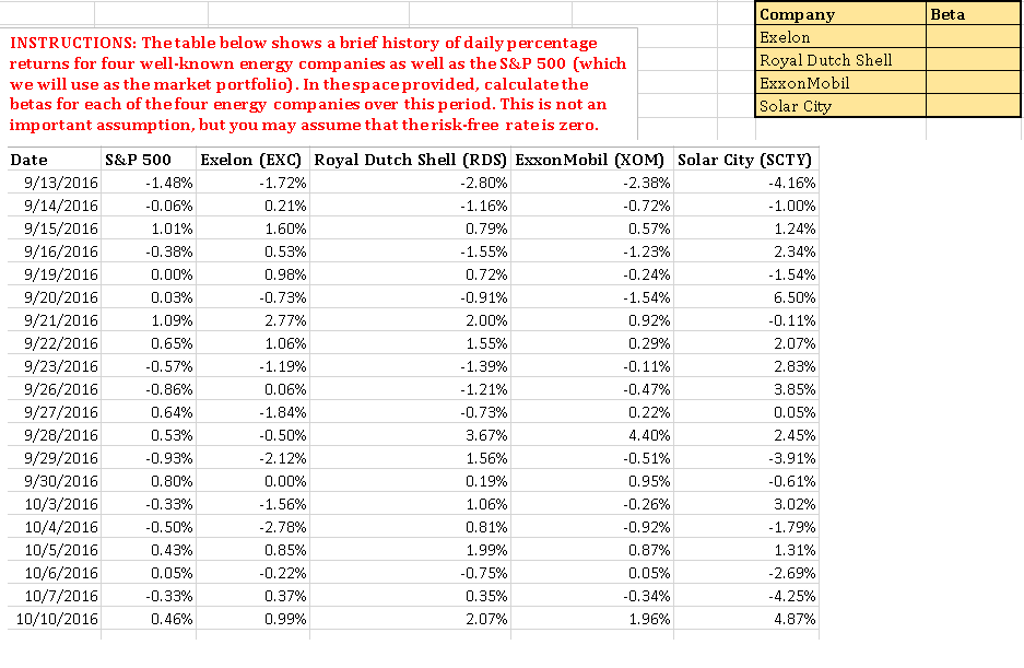
Company Exelon INSTRUCTIONS: The table below shows a brief history of daily percentage Royal Dutch Shell returns for four well-known energy companies as well as the S&P 500 (which ExxonMobil we will use as the market portfolio). In thespace provided, calculate the Solar City betas for each of the four energy companies over this period. This is not an important assumption, but you may assume that therisk-free rate is zero. S&P 500 Exel on (EXC) Royal Dutch Shell (RDS) ExkonMobil CKOMO Solar City (SCTY) Date -1.72% -2.80% 2.38% -4.16% -1.48% 9/13/2016 -0,06% 0.21% -1.16% -0,72% -1.00% 9/14/2016 1.01% 1.60% 0.19% 0.57% 1.24% 9/15/2016 0.53% -1.55% -1.23% 2.34% 9/16/2016 -0.38% 0.98% 0.72% -0.24% -1.54% 0.00% 9/19/2016 9/20/2016 0.03% 6.50% -0.73% -0.91% 1.54% 1,09% 2.77% 2.00% 0.92% -0.11% 9/21/2016 0.29% 2.07% 9/22/2016 0.65% 1.06% 1.55% -1.19% -1.39% -0.11% 2.83% 9/23/2016 -0.57% 9/26/2016 -0,86% 0.06% -1.21% -0.47% 3.85% 0.64% 1.84% -0.73% 0.22% 0.05% 9/27/2016 9/28/2016 0.53% -0.50% 3.67% 4.40% 2.45% 9/29/2016 -0.93% -2.12% 1.56% -0.51% -3.91% 9/30/2016 0.80% 0.00% 0.19% 0.95% -0.61% 10/3/2016 -0.33% -1.56% 1.06% -0.26% 3.02% 10/4/2016 -0.50% -2.78% 0.81% -0.92% -1.79% 0.43% 0.85% 1.99% 0.87% 1.31% 10/5/2016 10/6/2016 0,05% -0,22% -0,75% 0,05% 2,69% 10/7/2016 -0,33% 0.37% 0.35% -0.34% 4.25% 0,46% 0.99% 2.07% 1.96% 4.87% 10/10/2016
Step by Step Solution
There are 3 Steps involved in it
Step: 1
Get Instant Access to Expert-Tailored Solutions
See step-by-step solutions with expert insights and AI powered tools for academic success
Step: 2
Step: 3
Ace Your Homework with AI
Get the answers you need in no time with our AI-driven, step-by-step assistance
Get Started