Company is Tesla
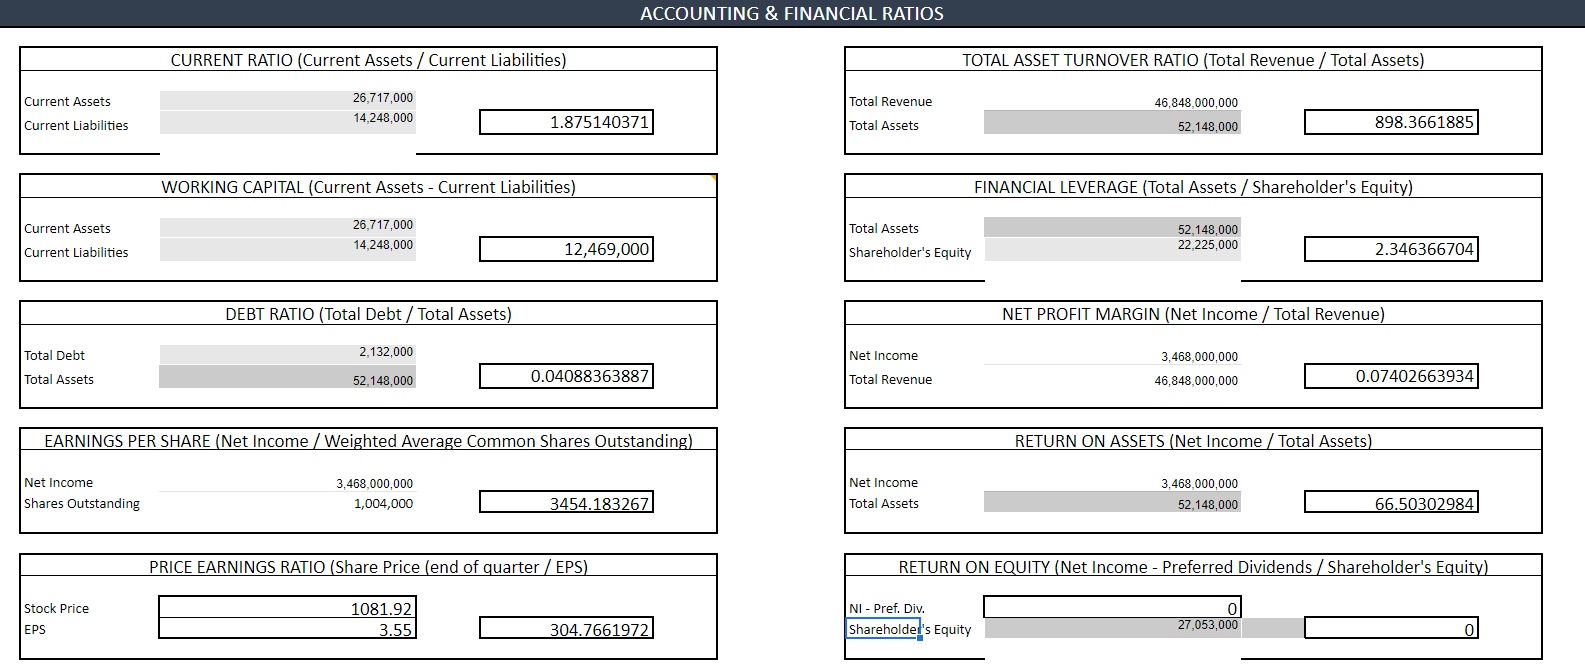
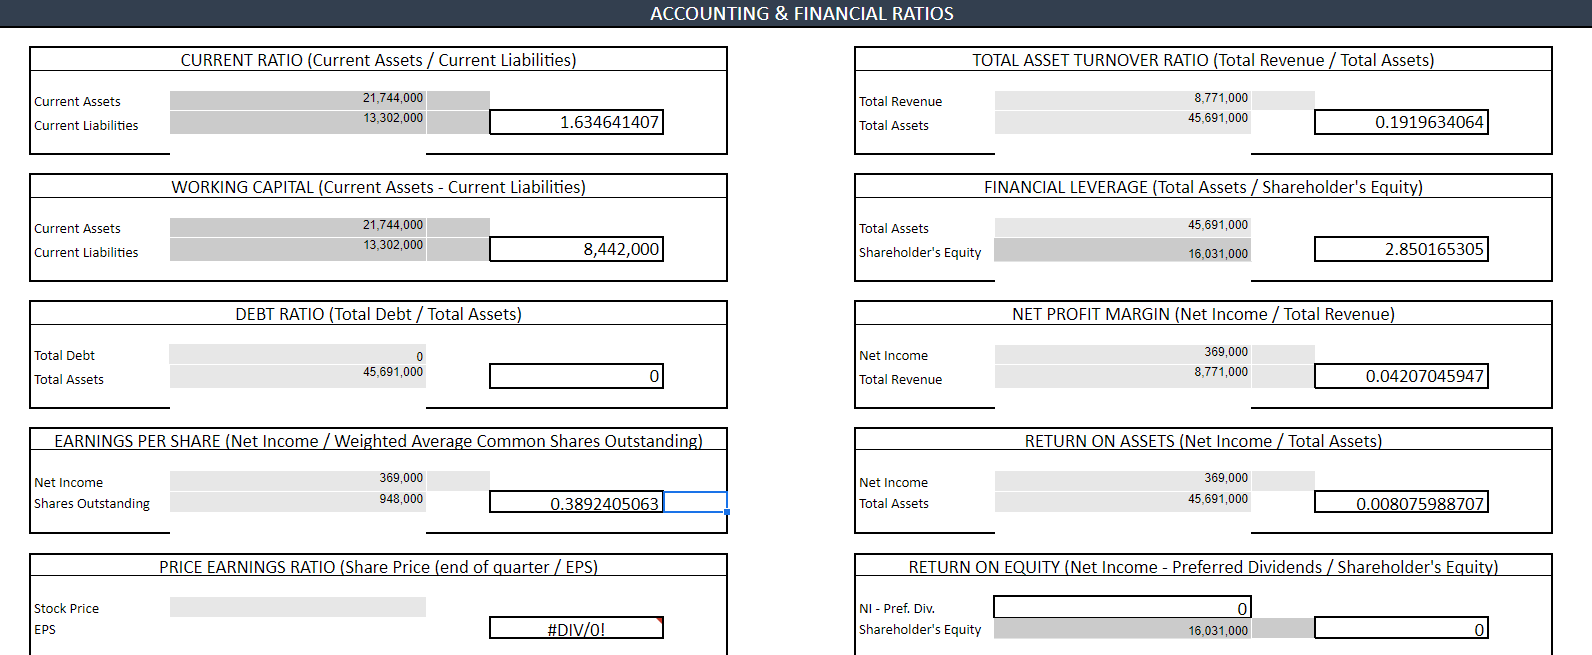
- Fiscal Quarter Comparison: Using Mergent Online, summarize the differences between the results from your financial calculations of the most recent fiscal quarter and the results of the same financial calculations of the same fiscal quarter from a year before for your chosen business.
- For example, if the most recent fiscal quarter available is the 3rd quarter in 2020, then you will compare those results to the same financial calculations from the 3rd quarter in 2019.
2021
2020
- Comparison Analysis: Explain what the results of your calculations and your comparison indicate about the businesss current financial health, providing examples to support your explanation. You might consider the following questions:
- Do the results indicate the business is financially healthy or financially unhealthy? Which results indicate this?
- What might be the cause(s) of the businesss financial success or failure?
- Is more information needed to determine the businesss financial health? If so, which pieces of information might still be needed?
- Short-Term Financing: Explain how potential short-term financing sources could help the business raise needed funds to improve its financial health. Base your response on the businesss current financial information.
ACCOUNTING & FINANCIAL RATIOS CURRENT RATIO (Current Assets / Current Liabilities) TOTAL ASSET TURNOVER RATIO (Total Revenue / Total Assets) Current Assets 26,717,000 14,248,000 Total Revenue 46,848,000,000 52,148,000 Current Liabilities 1.875140371 Total Assets 898.3661885 WORKING CAPITAL (Current Assets - Current Liabilities) FINANCIAL LEVERAGE (Total Assets / Shareholder's Equity) Current Assets 26,717,000 14.248.000 52,148,000 22,225,000 Total Assets Shareholder's Equity 12,469,000 Current Liabilities 2.346366704 DEBT RATIO (Total Debt / Total Assets) NET PROFIT MARGIN (Net Income / Total Revenue) Total Debt 2,132,000 Net Income 3.468,000,000 Total Assets 52,148,000 0.04088363887 Total Revenue 46,848,000,000 0.07402663934 EARNINGS PER SHARE (Net Income / Weighted Average Common Shares Outstanding) RETURN ON ASSETS (Net Income / Total Assets) Net Income Shares Outstanding 3,468,000,000 1,004,000 Net Income Total Assets 3,468,000,000 52,148,000 3454.183267 66.50302984 PRICE EARNINGS RATIO (Share Price (end of quarter / EPS) RETURN ON EQUITY (Net Income - Preferred Dividends / Shareholder's Equity) Stock Price EPS 1081.92 3.55 304.7661972 NI - Pref. Div. Shareholder's Equity 27,053,000 ACCOUNTING & FINANCIAL RATIOS CURRENT RATIO (Current Assets / Current Liabilities) TOTAL ASSET TURNOVER RATIO (Total Revenue / Total Assets) Current Assets Total Revenue 21,744,000 13,302,000 8,771,000 45,691,000 Current Liabilities 1.634641407 Total Assets 0.1919634064 WORKING CAPITAL (Current Assets - Current Liabilities) FINANCIAL LEVERAGE (Total Assets / Shareholder's Equity) Current Assets 45,691,000 21,744,000 13,302,000 Current Liabilities 8,442,000 Total Assets Shareholder's Equity 16,031,000 2.850165305 DEBT RATIO (Total Debt / Total Assets) NET PROFIT MARGIN (Net Income / Total Revenue) Total Debt Net Income 0 45,691,000 369.000 8,771,000 Total Assets Total Revenue 0.04207045947 EARNINGS PER SHARE (Net Income / Weighted Average Common Shares Outstanding) RETURN ON ASSETS (Net Income / Total Assets) Net Income Shares Outstanding 369,000 948,000 Net Income Total Assets 369,000 45.691.000 0.3892405063 0.008075988707) PRICE EARNINGS RATIO (Share Price (end of quarter/EPS) RETURN ON EQUITY (Net Income - Preferred Dividends / Shareholder's Equity) Stock Price EPS NI - Pref. Div. Shareholder's Equity #DIV/0! 0 16,031,000 ACCOUNTING & FINANCIAL RATIOS CURRENT RATIO (Current Assets / Current Liabilities) TOTAL ASSET TURNOVER RATIO (Total Revenue / Total Assets) Current Assets 26,717,000 14,248,000 Total Revenue 46,848,000,000 52,148,000 Current Liabilities 1.875140371 Total Assets 898.3661885 WORKING CAPITAL (Current Assets - Current Liabilities) FINANCIAL LEVERAGE (Total Assets / Shareholder's Equity) Current Assets 26,717,000 14.248.000 52,148,000 22,225,000 Total Assets Shareholder's Equity 12,469,000 Current Liabilities 2.346366704 DEBT RATIO (Total Debt / Total Assets) NET PROFIT MARGIN (Net Income / Total Revenue) Total Debt 2,132,000 Net Income 3.468,000,000 Total Assets 52,148,000 0.04088363887 Total Revenue 46,848,000,000 0.07402663934 EARNINGS PER SHARE (Net Income / Weighted Average Common Shares Outstanding) RETURN ON ASSETS (Net Income / Total Assets) Net Income Shares Outstanding 3,468,000,000 1,004,000 Net Income Total Assets 3,468,000,000 52,148,000 3454.183267 66.50302984 PRICE EARNINGS RATIO (Share Price (end of quarter / EPS) RETURN ON EQUITY (Net Income - Preferred Dividends / Shareholder's Equity) Stock Price EPS 1081.92 3.55 304.7661972 NI - Pref. Div. Shareholder's Equity 27,053,000 ACCOUNTING & FINANCIAL RATIOS CURRENT RATIO (Current Assets / Current Liabilities) TOTAL ASSET TURNOVER RATIO (Total Revenue / Total Assets) Current Assets Total Revenue 21,744,000 13,302,000 8,771,000 45,691,000 Current Liabilities 1.634641407 Total Assets 0.1919634064 WORKING CAPITAL (Current Assets - Current Liabilities) FINANCIAL LEVERAGE (Total Assets / Shareholder's Equity) Current Assets 45,691,000 21,744,000 13,302,000 Current Liabilities 8,442,000 Total Assets Shareholder's Equity 16,031,000 2.850165305 DEBT RATIO (Total Debt / Total Assets) NET PROFIT MARGIN (Net Income / Total Revenue) Total Debt Net Income 0 45,691,000 369.000 8,771,000 Total Assets Total Revenue 0.04207045947 EARNINGS PER SHARE (Net Income / Weighted Average Common Shares Outstanding) RETURN ON ASSETS (Net Income / Total Assets) Net Income Shares Outstanding 369,000 948,000 Net Income Total Assets 369,000 45.691.000 0.3892405063 0.008075988707) PRICE EARNINGS RATIO (Share Price (end of quarter/EPS) RETURN ON EQUITY (Net Income - Preferred Dividends / Shareholder's Equity) Stock Price EPS NI - Pref. Div. Shareholder's Equity #DIV/0! 0 16,031,000