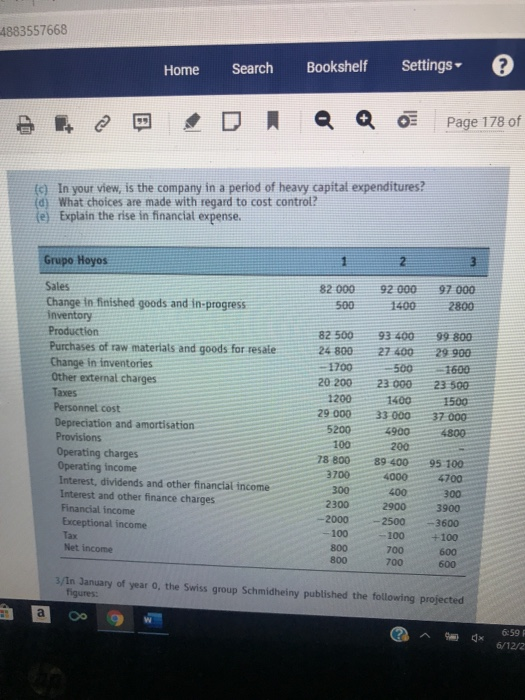
company's position relative to its breakeven point. 2/Below are the income statements for the Spanish Hoyos group. The company asks you to analyse these statements and answer the following questions: (a) What is your opinion of the company? (b) Is the company moving closer towards or further away from breakeven point? 4883557668 Home Search Bookshelf Settings ? Page 178 of (c) In your view, is the company in a period of heavy capital expenditures? (d) What choices are made with regard to cost control? (e) Explain the rise in financial expense. Grupo Hoyos 82 000 500 92 000 400 97 000 2800 Sales Change in finished goods and in-progress inventory Production Purchases of raw materials and goods for resale Change in inventories Other external charges Taxes Personnel cost Depreciation and amortisation Provisions Operating charges Operating income Interest, dividends and other financial income Interest and other finance charges Financial income Exceptional income Tas Net Income 99 800 29 900 1600 23 500 1500 37 000 4800 82 500 24 800 -1700 20 200 1200 29.000 5200 100 78 800 3700 300 2300 -2000 -100 800 800 93 400 27 400 500 23 000 1400 33 000 4900 200 89 400 4000 400 2900 -2500 - 100 700 700 95 100 4700 300 3900 3600 +100 600 600 3/In January of year 0, the Swiss group Schmidheiny published the following projected figures: a 6:59 6/12/2 company's position relative to its breakeven point. 2/Below are the income statements for the Spanish Hoyos group. The company asks you to analyse these statements and answer the following questions: (a) What is your opinion of the company? (b) Is the company moving closer towards or further away from breakeven point? 4883557668 Home Search Bookshelf Settings ? Page 178 of (c) In your view, is the company in a period of heavy capital expenditures? (d) What choices are made with regard to cost control? (e) Explain the rise in financial expense. Grupo Hoyos 82 000 500 92 000 400 97 000 2800 Sales Change in finished goods and in-progress inventory Production Purchases of raw materials and goods for resale Change in inventories Other external charges Taxes Personnel cost Depreciation and amortisation Provisions Operating charges Operating income Interest, dividends and other financial income Interest and other finance charges Financial income Exceptional income Tas Net Income 99 800 29 900 1600 23 500 1500 37 000 4800 82 500 24 800 -1700 20 200 1200 29.000 5200 100 78 800 3700 300 2300 -2000 -100 800 800 93 400 27 400 500 23 000 1400 33 000 4900 200 89 400 4000 400 2900 -2500 - 100 700 700 95 100 4700 300 3900 3600 +100 600 600 3/In January of year 0, the Swiss group Schmidheiny published the following projected figures: a 6:59 6/12/2


